
Things you see in a recovery
For 26 months we have been tracking the anatomy of a small cap drawdown. All the signs have been there that we were closer to the end than the beginning of small cap underperformance for some time, specifically:
- Duration of drawdown: The prior longest was post the tech bubble bursting in 2000 at 18 months, and the current episode surpassed that length in mid 2023,
- Magnitude of drawdown: in the GFC we saw 20-25% small cap index underperformance. In the tech wreck we saw 35%. This time we got to around 25-30%,
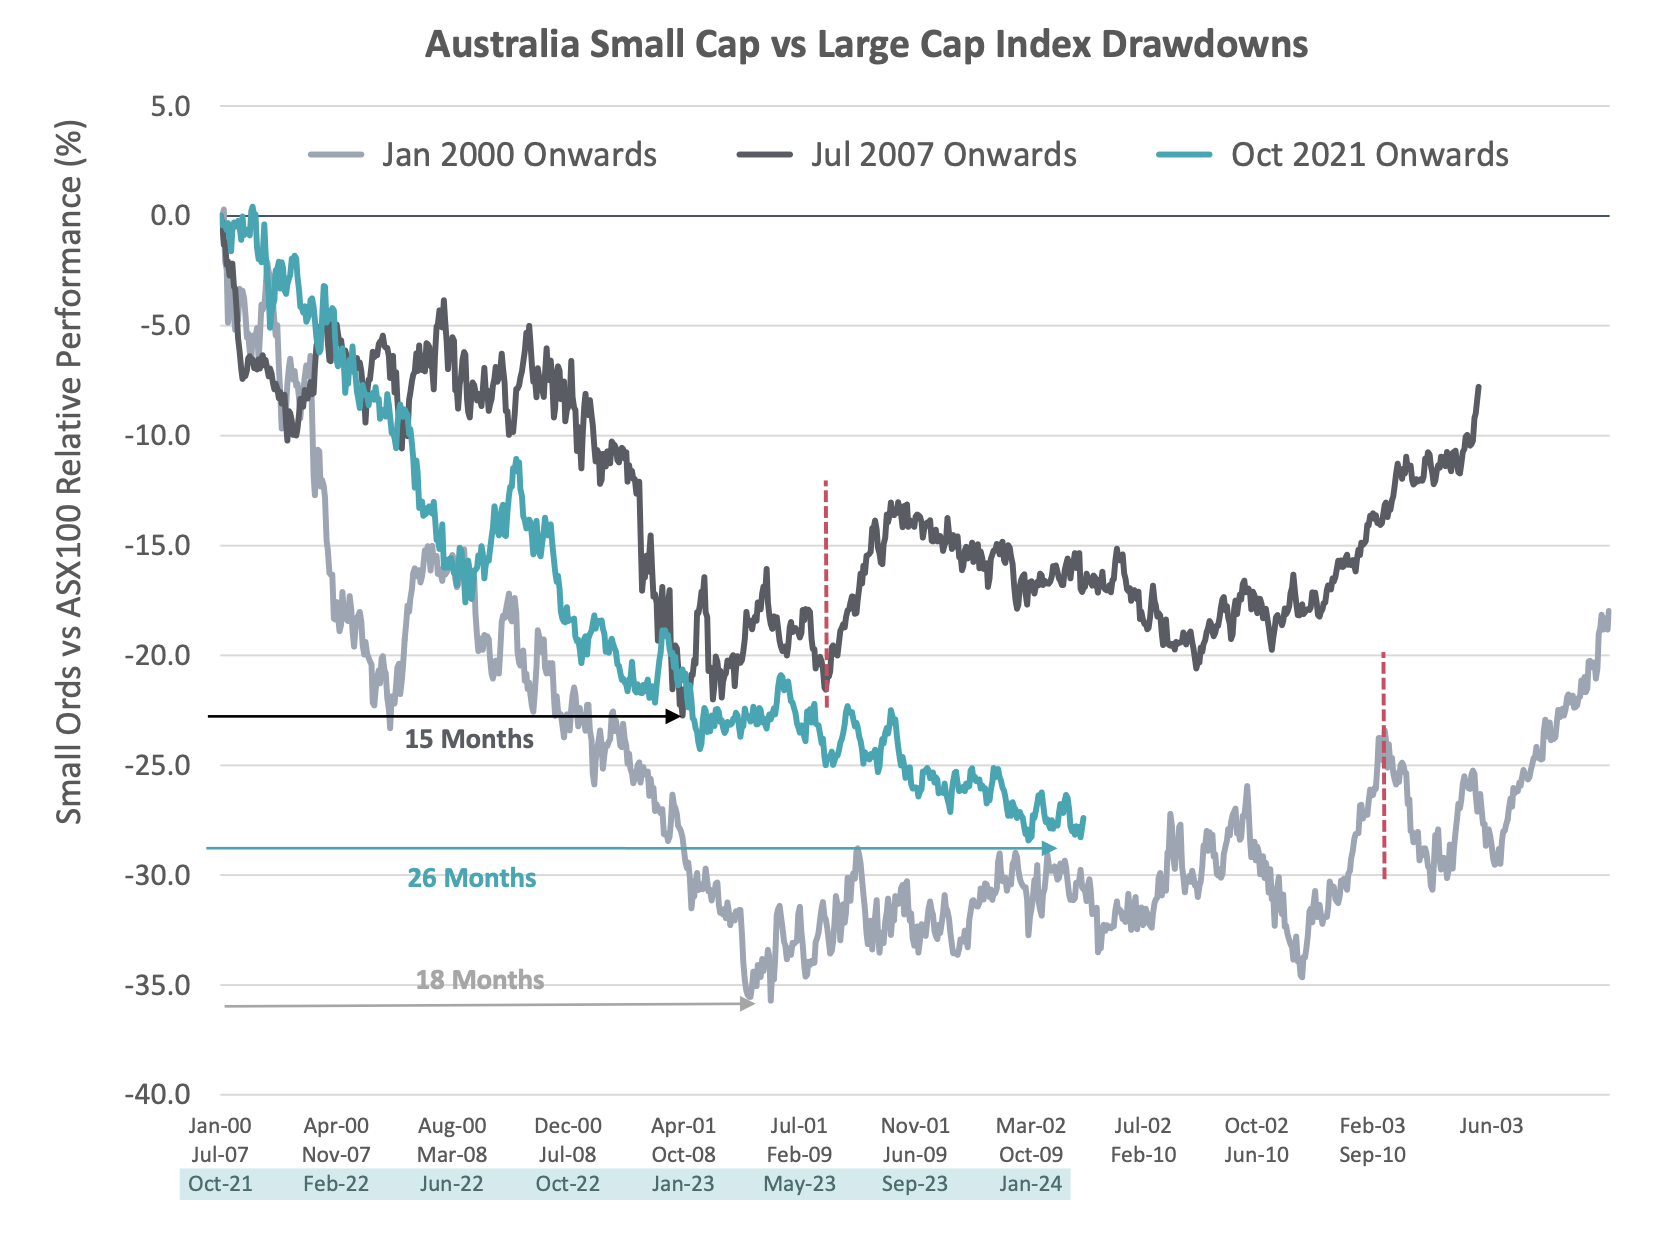 Source: Bloomberg, Longwave Capital Partners. 29 Feb 2024. Starting point was the highest relative small cap index performance prior to drawdown.
- Liquidity: on multiple measures, the liquidity of the small cap market collapsed. Trading volumes dropped around 50% from peak (early 2021) to trough (late 2023). Weighted average bid-ask spreads for stocks in the Small Ords index widened from 27/28 bps (mid 2021) to 40bps (mid 2023),
- Capital markets: IPO activity completely dried up,
- Client allocations: By 2023 it seemed like everyone was underweight small caps and most people were not interested in adding back. This included large cap managers who tend to move in and out of the small cap market – and who for the past two years have been actively tilting large (there is a reason CBA is at record levels).
- Macro fear: the single biggest fear holding back most investors was the view that a recession was highly likely and if it occurred small caps would get smashed. This may be true, but recession forecasting has a bad track record and there surely is the chance we don’t get one? There is also a chance we still do. We offer no view here.
- Valuations: Valuation multiples on small caps compressed relative to large caps. We could never see this as starkly in Australia as some commentators suggested (it was clearer overseas) and we are a bit wary of torturing data to make the story fit. Even if valuations were not at “generational low levels” they were certainly more attractive, particularly relative to the growth options many small caps have.
It started to get old. Investors who have been through multiple cycles rightly (in our view) figured this was just another one and when the market gives you opportunities you probably should take them. Having reached a low in October 2023, small caps have recovered and are now running line-ball with large cap returns over the past year. Some signs that life is returning to the small cap market and we could be in the midst of a recovery include:
- Earnings are OK: the most recent reporting season confirmed what many companies had been telling investors during the latter part of 2023. The environment remains challenging (inflation, interest rates, consumer sentiment etc) but not collapsing. In some of the more economically sensitive sectors, earnings were much better than expected 6-9 months ago, and across the board earnings expectations mostly held up,
- M&A activity has picked up sharply: One of the clearest signs that values are compelling is control buyers are willing to cross a 30% spread (ie: pay the control premium) to take companies private while public market investors watch from the sidelines.
- Early signs of life in IPOs: Will the Reddit IPO in the US signal the re-opening of the market? Maybe. We do know that there are a lot of privately held companies itching for some exit liquidity – whether they are over-seasoned VC funds, pre-IPO funds that were expecting to list years ago or private equity funds needing to turn their marked positions into real cash (and bankable carry). If the quality of issues is anything like what we saw last cycle (2020/21) we are unlikely to participate in much, but the noise, excitement, and FOMO it creates does tend to spill over into small caps more generally.
Why does this matter?
Active small caps generate significant alpha, not just relative to the passive small cap benchmark but also to large caps (both passive and active). This alpha is not evenly distributed over time, and a significant portion of a through-the-cycle excess return from small caps comes in the early stages of a recovery.
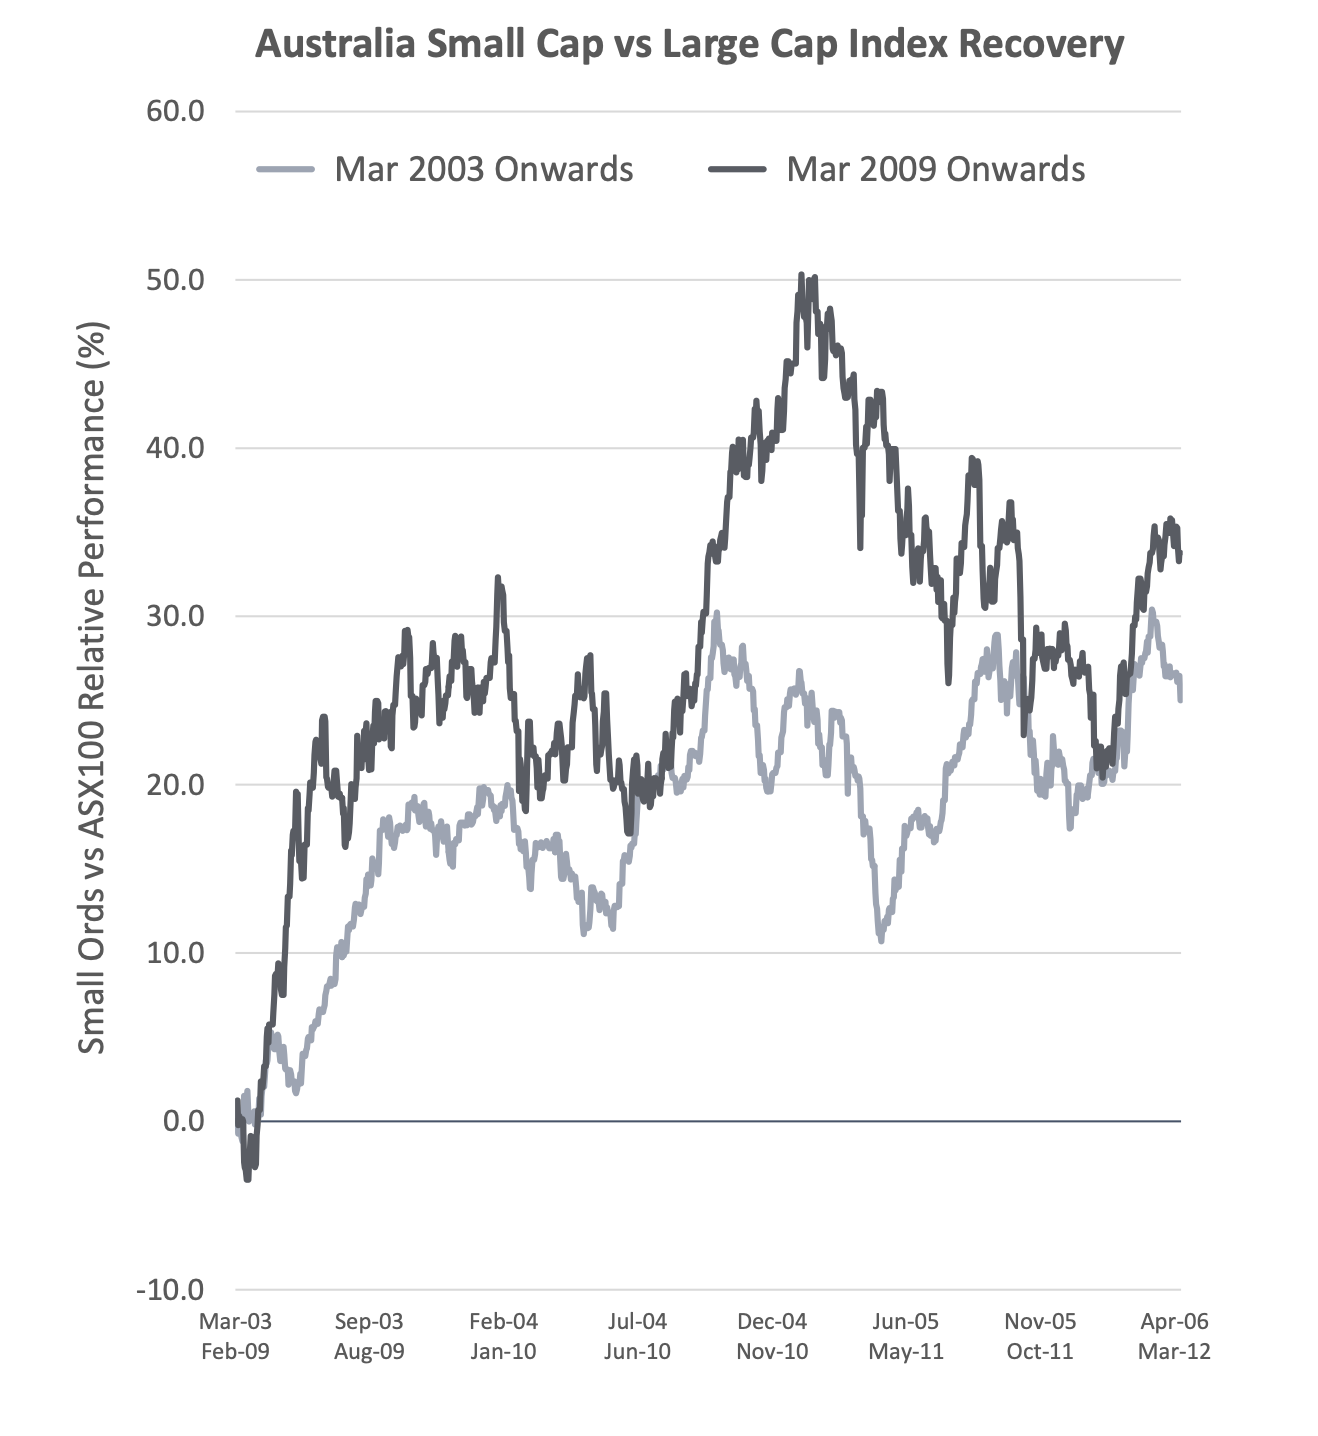
Source: Bloomberg, Longwave Capital Partners. 29 Feb 2024. Starting point was the low point in the overall market.
If we look at the prior cycle recoveries from 2003 and 2009 respectively, we saw small cap index outperformance of large caps by 20% (2003) and 30% (2009) within the first six months. In both cases, the active small cap managers tended to pace the index in the first phase of the recovery then continue to outperform both small and large indices for the next 3 years. It is a domestic sample size of two, and the drawdown experience has shown that every cycle is different, but research across cycles and across markets (many samples) confirms this pattern. Sharp small cap outperformance in the early stages of a recovery is very common. Missing this can undermine the through the cycle benefits of actively investing in small caps.
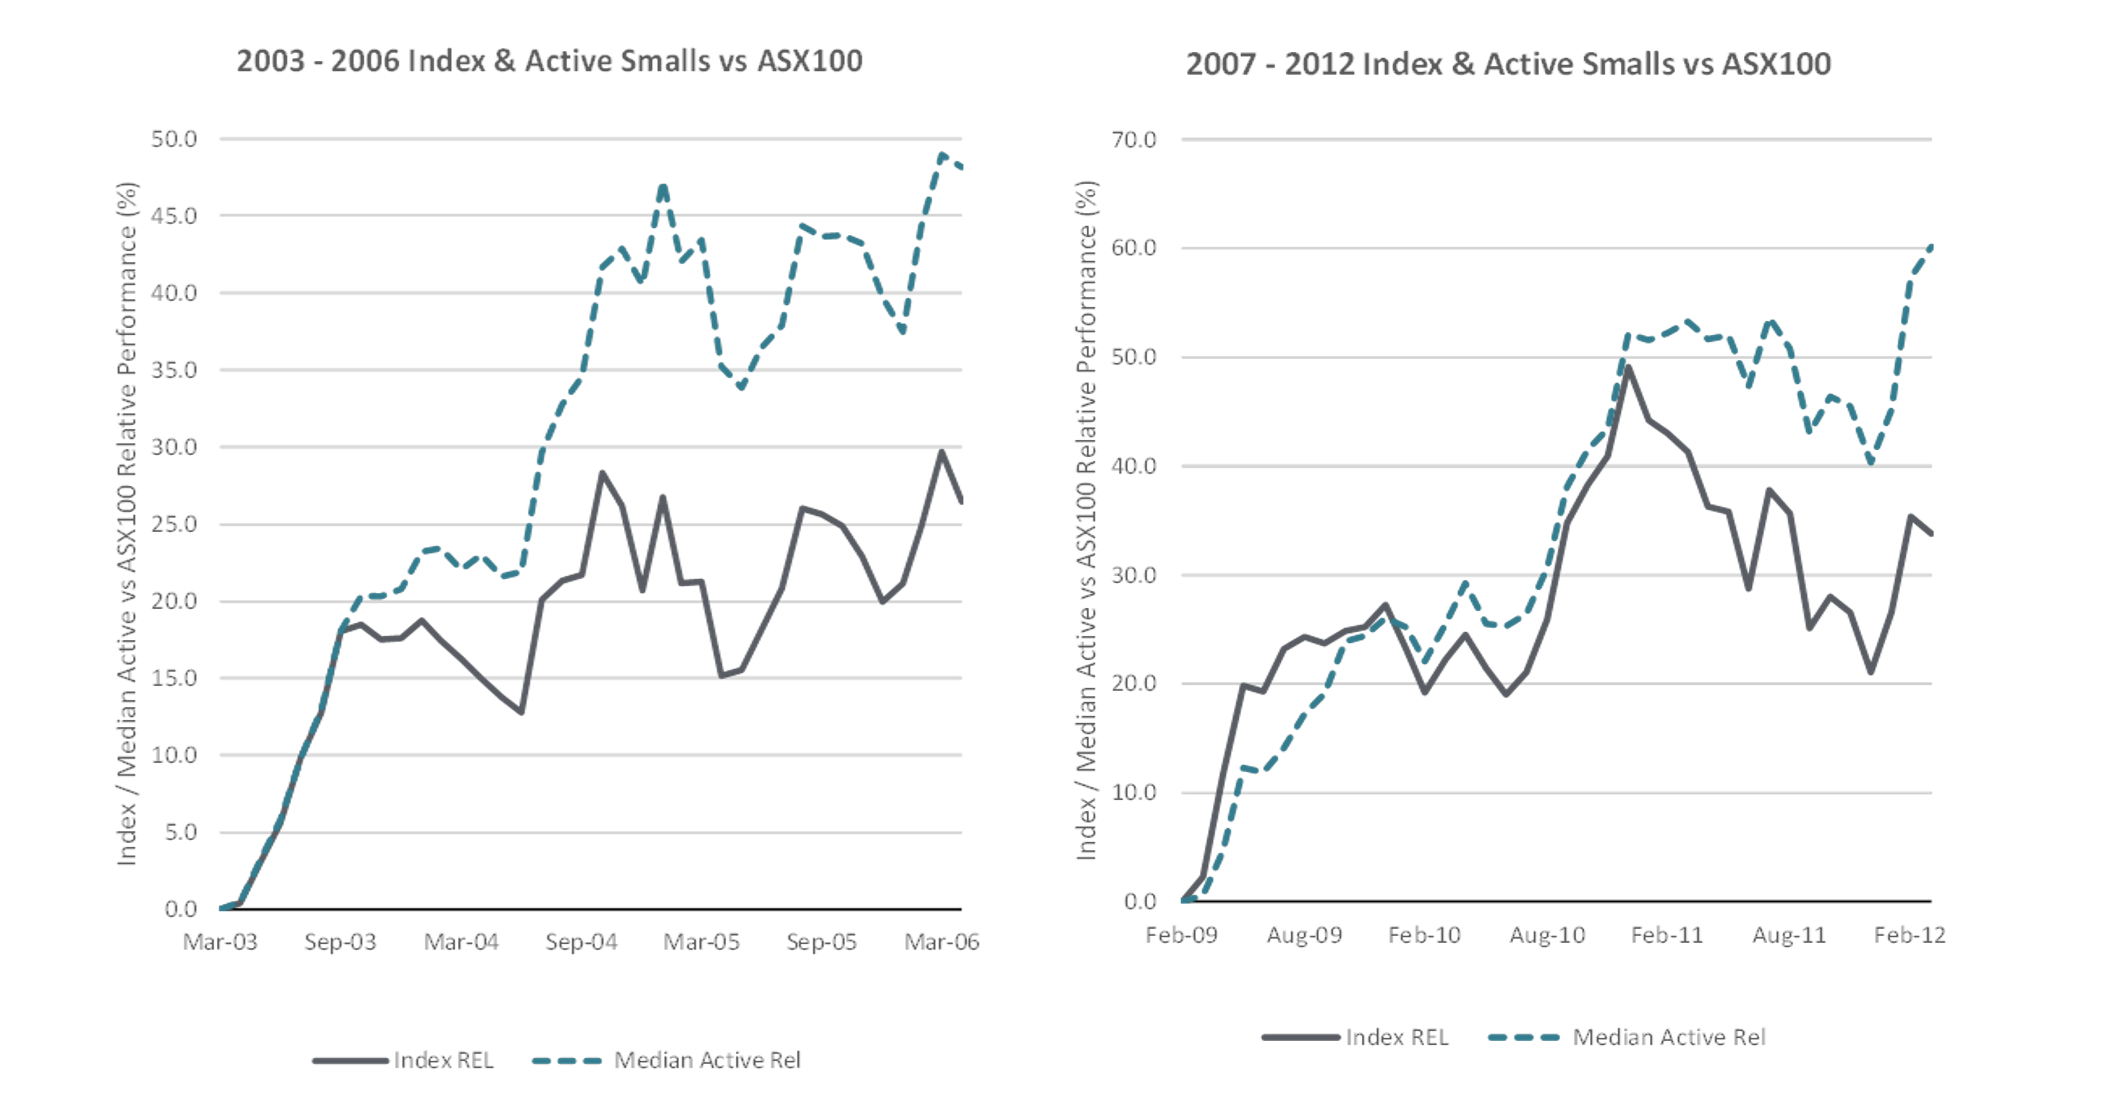 Source: Bloomberg, Longwave Capital Partners. 29 Feb 2024. Starting point was the low point in the overall market.
Timing this cycle is outside our process. More specifically, members of the Longwave investment team undertook significant research earlier in our careers on timing models for Australian small vs large caps and found nothing that worked better than having a small cap strategy designed to perform through the cycle held as a strategic allocation and diversified to other asset allocations in the total portfolio.
So that is what we believe.
- The benefits of active small caps to long-term returns are clear.
- The ability to time Australian large vs small through cycles is very very hard.
- Therefore, hold a strategic allocation to a small cap strategy that can perform well through the cycle, and most market regimes (value / growth, bull / bear, industrial / resources, inflation / deflation) and stick to the plan. Simple but not easy.
Disclaimer
This communication is prepared by Longwave Capital Partners (‘Longwave’) (ABN 17 629 034 902), a corporate authorised representative (No. 1269404) of Pinnacle Investment Management Limited (‘Pinnacle’) (ABN 66 109 659 109, AFSL 322140) as the investment manager of Longwave Australian Small Companies Fund (ARSN 630 979 449) (‘the Fund’). Pinnacle Fund Services Limited (‘PFSL’) (ABN 29 082 494 362, AFSL 238371) is the product issuer of the Fund. PFSL is not licensed to provide financial product advice. PFSL is a wholly-owned subsidiary of the Pinnacle Investment Management Group Limited (‘Pinnacle’) (ABN 22 100 325 184). The Product Disclosure Statement (‘PDS’) and Target Market Determination (‘TMD’) of the Fund are available via the links below. Any potential investor should consider the PDS and TMD before deciding whether to acquire, or continue to hold units in, the Fund.
Link to the Product Disclosure Statement: WHT9368AU
Link to the Target Market Determination: WHT9368AU
For historic TMD’s please contact Pinnacle client service Phone 1300 010 311 or Email service@pinnacleinvestment.com
This communication is for general information only. It is not intended as a securities recommendation or statement of opinion intended to influence a person or persons in making a decision in relation to investment. It has been prepared without taking account of any person’s objectives, financial situation or needs. Any persons relying on this information should obtain professional advice before doing so. Past performance is for illustrative purposes only and is not indicative of future performance.
Whilst Longwave, PFSL and Pinnacle believe the information contained in this communication is reliable, no warranty is given as to its accuracy, reliability or completeness and persons relying on this information do so at their own risk. Subject to any liability which cannot be excluded under the relevant laws, Longwave, PFSL and Pinnacle disclaim all liability to any person relying on the information contained in this communication in respect of any loss or damage (including consequential loss or damage), however caused, which may be suffered or arise directly or indirectly in respect of such information. This disclaimer extends to any entity that may distribute this communication.
Any opinions and forecasts reflect the judgment and assumptions of Longwave and its representatives on the basis of information available as at the date of publication and may later change without notice. Any projections contained in this presentation are estimates only and may not be realised in the future. Unauthorised use, copying, distribution, replication, posting, transmitting, publication, display, or reproduction in whole or in part of the information contained in this communication is prohibited without obtaining prior written permission from Longwave. Pinnacle and its associates may have interests in financial products and may receive fees from companies referred to during this communication.
This may contain the trade names or trademarks of various third parties, and if so, any such use is solely for illustrative purposes only. All product and company names are trademarks™ or registered® trademarks of their respective holders. Use of them does not imply any affiliation with, endorsement by, or association of any kind between them and Longwave.