
Are we there yet?
One of the most common questions from investors right now is when will inflation peak? When will interest rates peak? Will we get a recession? Inflation leading indicators look to be rolling over, but no one knows the answers to all these questions with confidence.
We thought we would revisit some more practical markers of how investors can think about the role of small caps in their portfolio and if now is the time to start adding.
Let’s start by taking a step back. Why do we even invest in small caps?
Well because over the past 20 years, the median active small cap manager has delivered significant excess returns – over both the small cap index and the broader equity market.
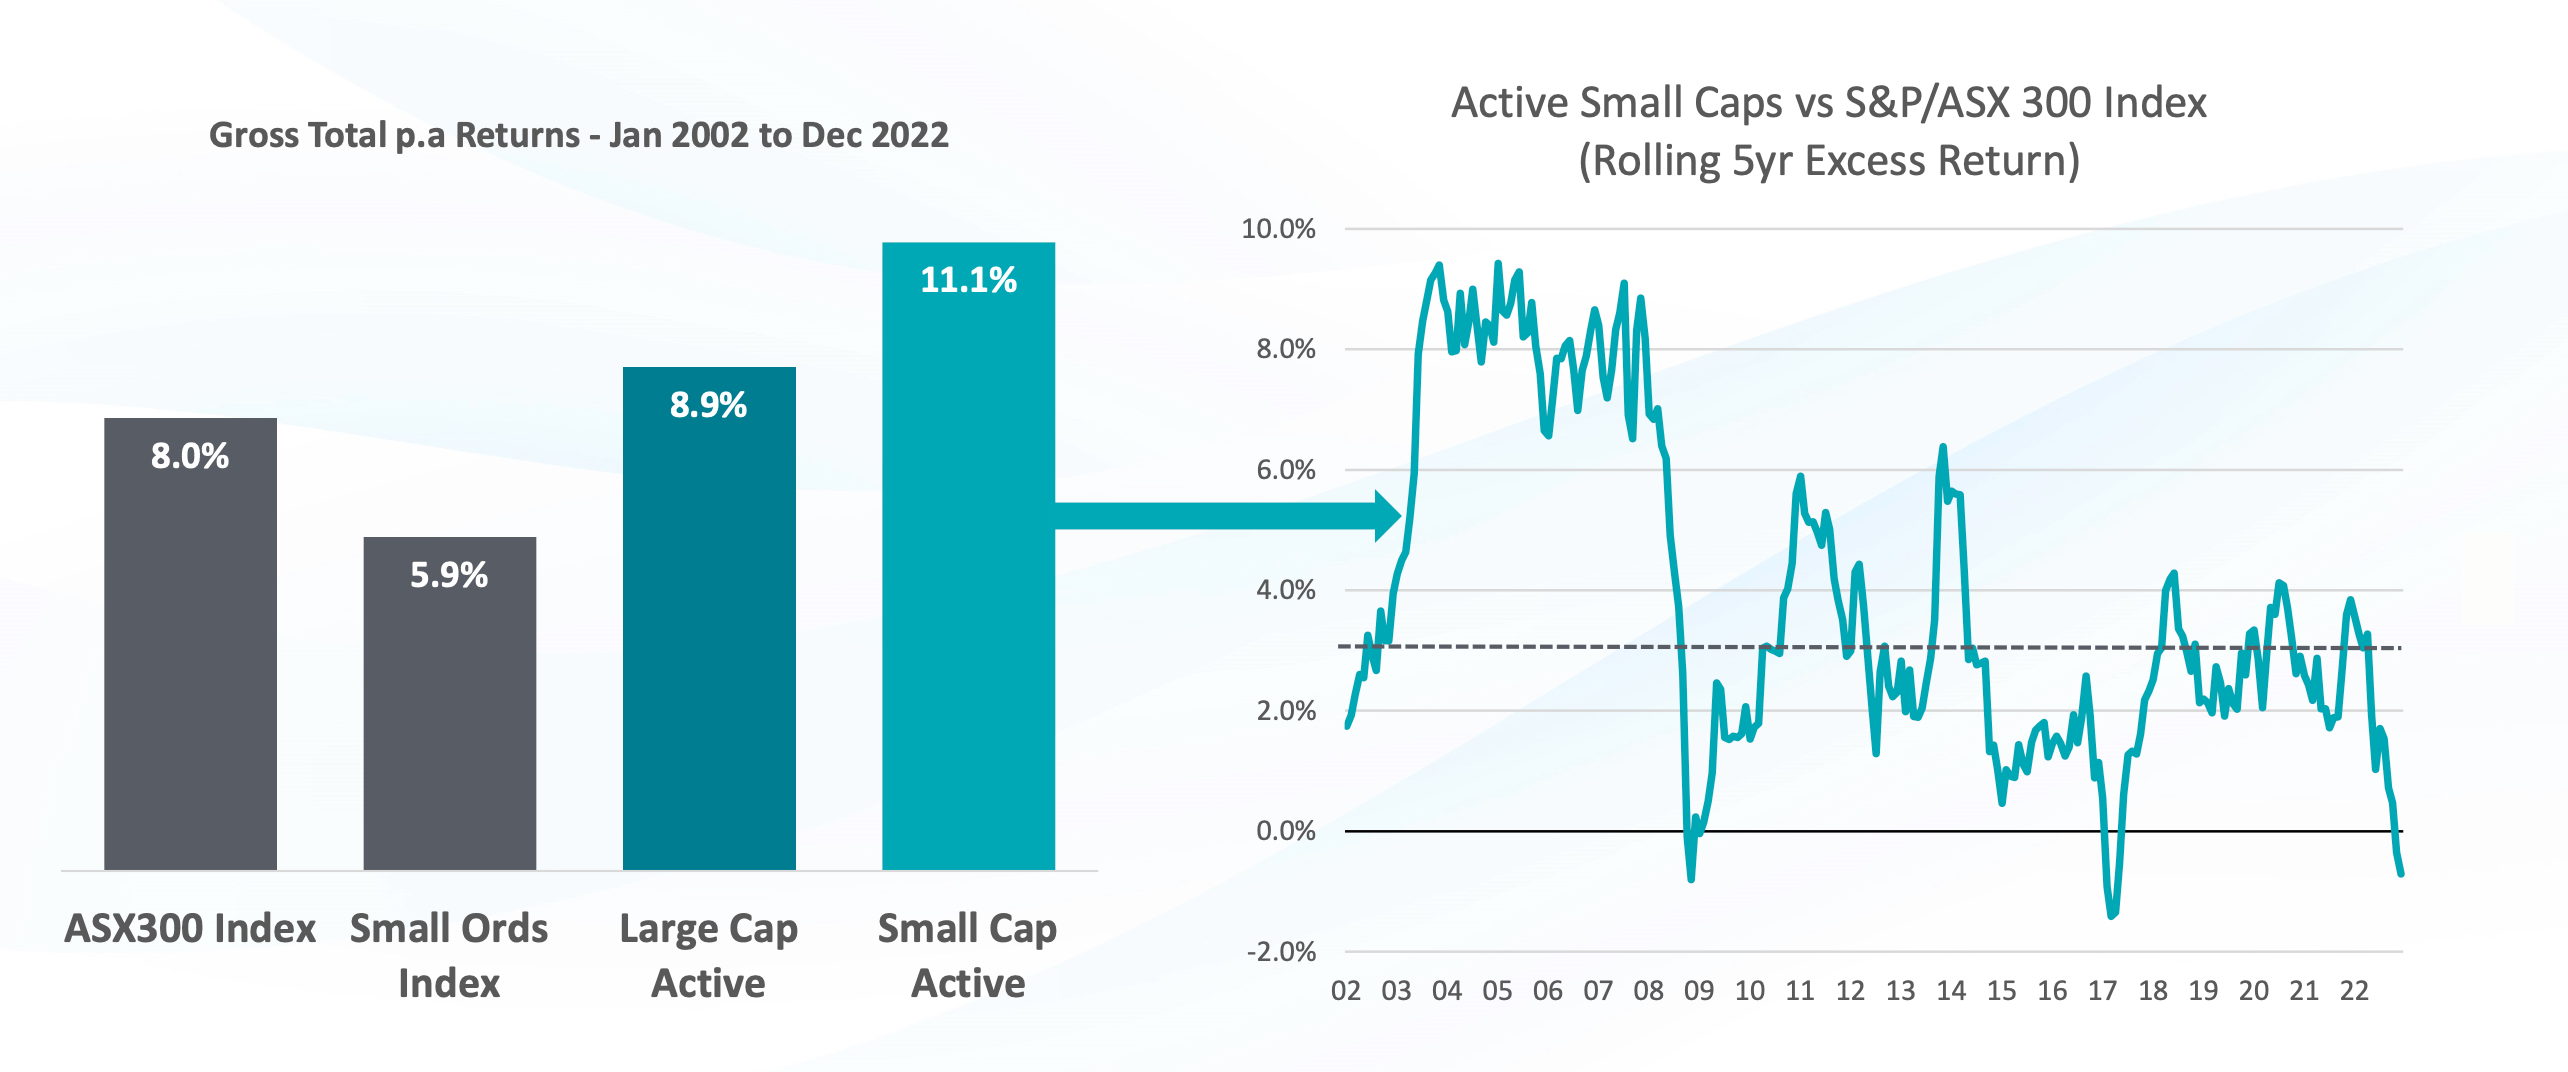 Source: eVestment median active manager gross returns. 31 Jan 2002 to 31 Dec, 2022. Past performance is not a reliable indicator of future performance.
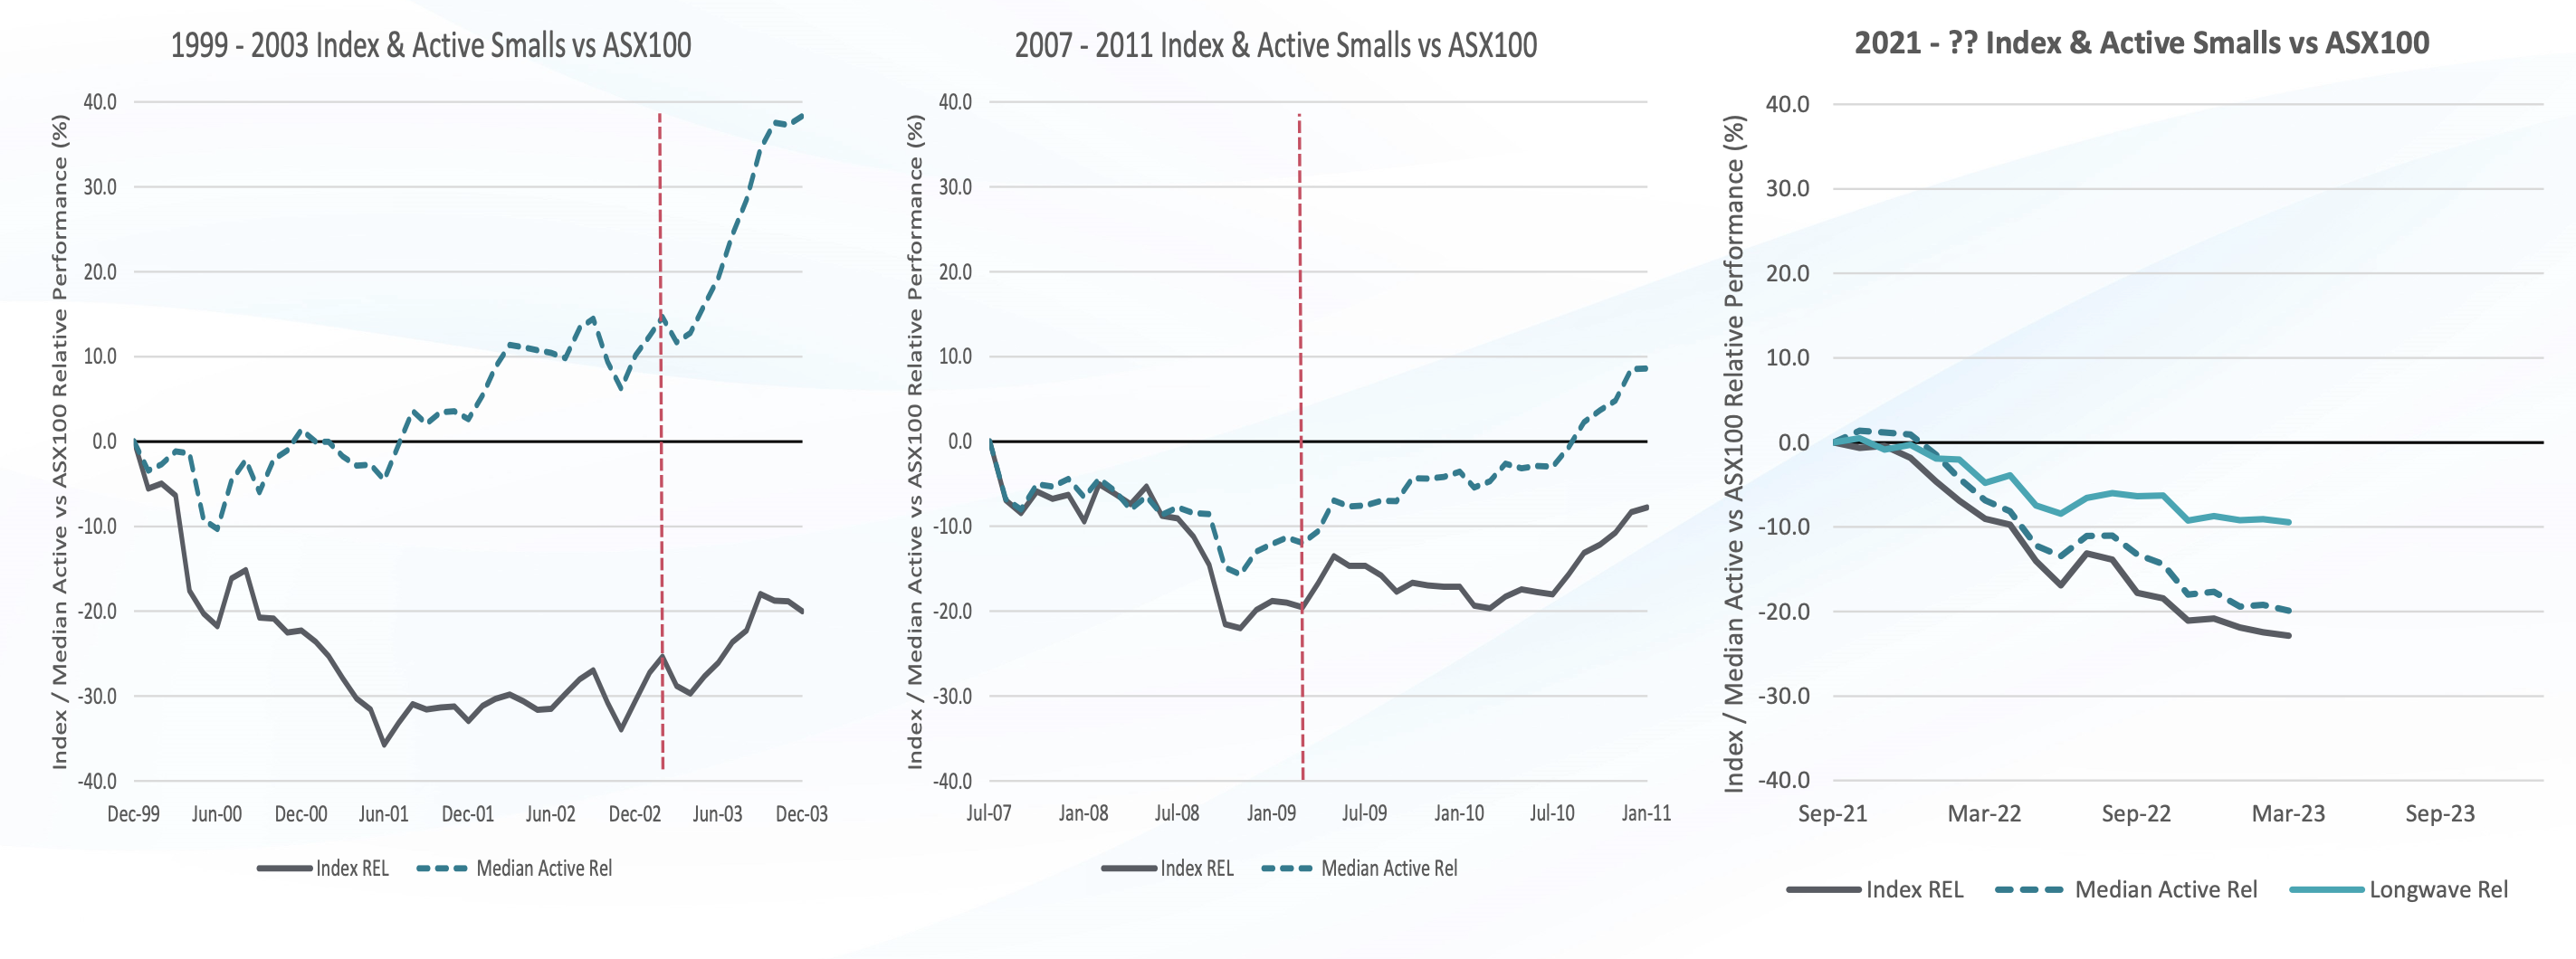
But this alpha is cyclical. There are times when active small caps perform much much better than the market (usually coming out of a recession like in 2003 – 2006 or 2009 – 2015). And there are times when they perform worse. Like the past 18 months. For those investors who like buying straw hats in the winter, small caps once again look very attractive relative to large caps on a 3-5 year time horizon. But don’t you know a recession is coming? Don’t you know that rising interest rates and resetting home loans will kill the consumer?
Perhaps, but maybe some of this is already reflected in stock prices and earnings.
Now we don’t know for sure if there will be a recession. And despite confident predictions, we don’t believe anyone else does either. Over time and across markets, small caps have tended to underperform into a recession, and then stop underperforming when it actually arrives.
So are we there yet? Should clients continue reducing small caps in their portfolios, or consider adding them back?
In November last year we analysed the prior examples of small cap underperformance in 2000 – 2003 (Tech Wreck) and 2007 – 2009 (GFC), so we won’t go over that ground again. Since that time the current episode of underperformance has continued and has now surpassed the GFC experience in both drawdown vs the ASX100 (24% vs 22%) and time (17 months vs 15 months). Indeed we are now approaching the duration of underperformance seen during the Tech Wreck (18 months) although we are some way off the drawdown vs ASX100 seen then (-36%).
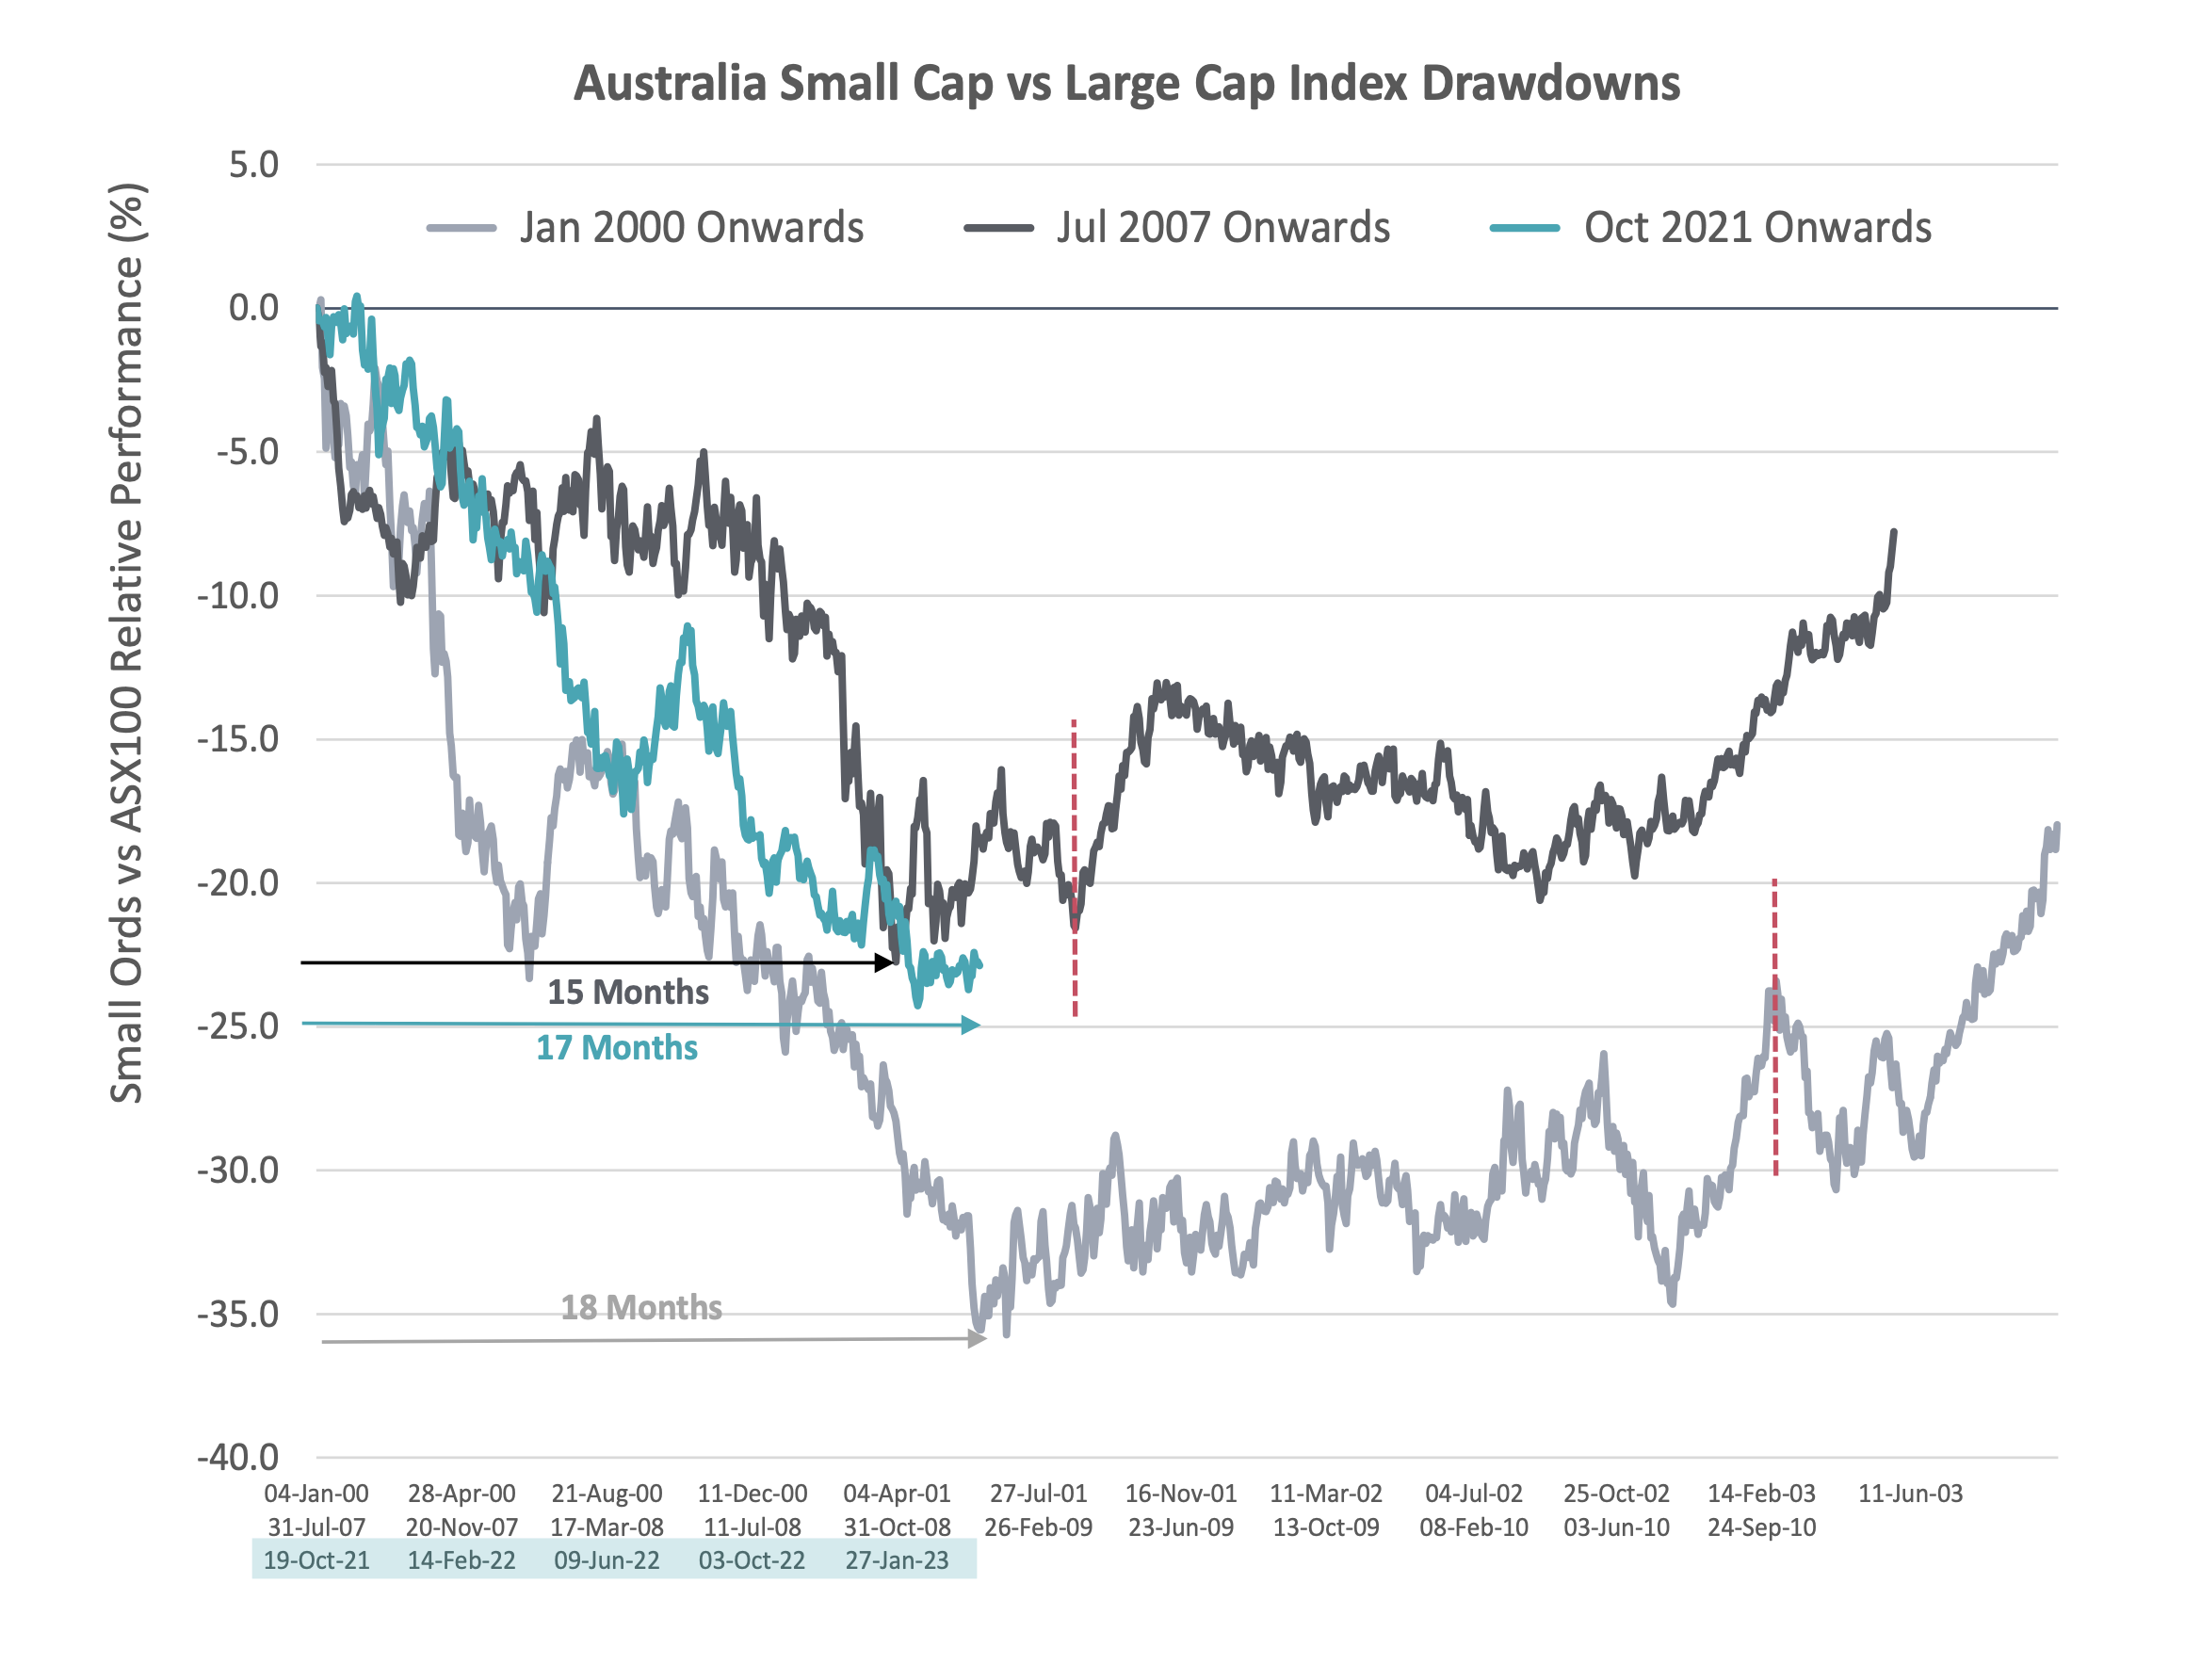
Source: Bloomberg, eVestment, Longwave Capital Partners. March 2023. Chart 2 Starting point was the highest relative small cap index performance prior to drawdown.
In talking with clients, many of whom who are now actively underweight small caps in their asset allocation, the discussion inevitably turns to catalysts. What event will result in small caps underperformance stopping?
Sorry – again we have no idea. Even in hindsight, it is still not clear today what the catalyst was in prior cycles, we have little chance of picking it in real time today. Although one thing has become clearer – the underweight to small caps is now a very consensus position. Not only within allocators portfolios, but also within large and all-cap equity manager portfolios who have discretion to allocate to small caps. Everyone has been crowding into large and liquid (there is a reason why CBA and BHP hit all time highs in February) which begs the question – who is left to sell small caps?
The underperformance has largely happened. Quality stocks are priced attractively (we are more cautious on the quality of the small cap index). Once the catalyst becomes obvious, new buyers are ready to go.
Re-basing of earnings expectations
The market awaits large downgrades to company earnings from a recession. A rebasing event to give the ‘all clear’. This may still be in front of us, but we have already seen a meaningful reduction in earnings expectations.
At the index level, consensus expects EPS for the next 12 months to be similar to the level of earnings seen in 2018. Earnings expectations have already reduced by close to 20% since their peak in mid-2022.
Our portfolio has not escaped downwards revisions, also seeing earnings expectations 15-20% lower than the recent peak in mid-2022, however unlike the index the compounding of earnings inside quality companies has meant our portfolio company earnings remain well ahead of where they were five years ago.
As we have discussed previously, the long term driver of investment returns comes mostly from fundamentals (earnings growth and dividends). The perennial disappointing EPS growth delivery from lower quality small caps is the single biggest source of excess return from investing in high quality small companies.
Some risks long term investors don’t get paid to take
Risk is a funny thing – captured well by Financial Planner Carl Richards as “Risk is what’s left over after you think you’ve thought of everything”.
We believe there are several risks for which long-term small cap investors are not rewarded, but it is easy to forget them in the short term (which concerns most investors most of the time). Risks that only show up once every five to ten years are ignored – until they become the new most important thing. Boring concepts like earnings quality, financial leverage, commercial viability, corporate governance, management integrity and stock liquidity can be ignored when they are unseen.
Liquidity is a risk now being focused on by small cap investors, but it was always a risk. When liquidity was at record high levels two years ago, we expressed our concerns. We passed on some promising investment opportunities because the liquidity risk was too great. Liquidity risk assessment is part of both the stock selection and portfolio construction stages of our investment process.
We observe liquidity drying up across the market, particularly at the microcap end – both in terms of declining volumes and dollars of shares traded, plus an increase in bid-ask spreads. Having seen some spread widening in our portfolio mid to late last year, this has since narrowed back to levels similar to late 2021. The Small Ords Index weighted constituent spreads are currently 30% wider than they were in late 2021.
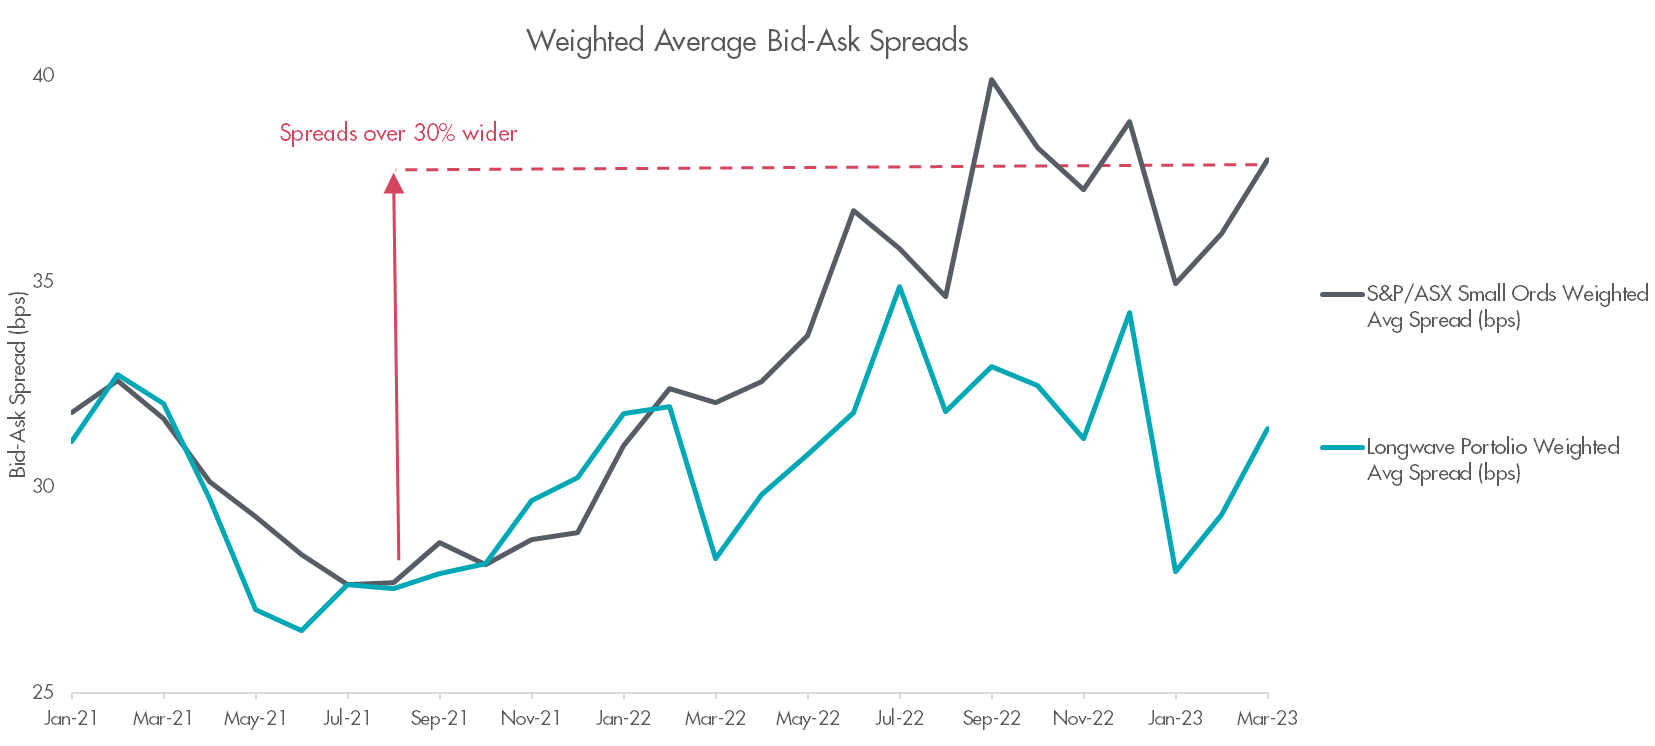 Source: Bloomberg, Longwave Capital Partners. 31 Mar, 2023. Longwave small cap universe includes ASX and NZ listed securities outside of the S&P/ASX100 index with a minimum market cap of A$25m.
Disclaimer
This communication is prepared by Longwave Capital Partners (‘Longwave’) (ABN 17 629 034 902), a corporate authorised representative (No. 1269404) of Pinnacle Investment Management Limited (‘Pinnacle’) (ABN 66 109 659 109, AFSL 322140) as the investment manager of Longwave Australian Small Companies Fund (ARSN 630 979 449) (‘the Fund’). Pinnacle Fund Services Limited (‘PFSL’) (ABN 29 082 494 362, AFSL 238371) is the product issuer of the Fund. PFSL is not licensed to provide financial product advice. PFSL is a wholly-owned subsidiary of the Pinnacle Investment Management Group Limited (‘Pinnacle’) (ABN 22 100 325 184). The Product Disclosure Statement (‘PDS’) and Target Market Determination (‘TMD’) of the Fund are available via the links below. Any potential investor should consider the PDS and TMD before deciding whether to acquire, or continue to hold units in, the Fund.
Link to the Product Disclosure Statement: WHT9368AU
Link to the Target Market Determination: WHT9368AU
For historic TMD’s please contact Pinnacle client service Phone 1300 010 311 or Email service@pinnacleinvestment.com
This communication is for general information only. It is not intended as a securities recommendation or statement of opinion intended to influence a person or persons in making a decision in relation to investment. It has been prepared without taking account of any person’s objectives, financial situation or needs. Any persons relying on this information should obtain professional advice before doing so. Past performance is for illustrative purposes only and is not indicative of future performance.
Whilst Longwave, PFSL and Pinnacle believe the information contained in this communication is reliable, no warranty is given as to its accuracy, reliability or completeness and persons relying on this information do so at their own risk. Subject to any liability which cannot be excluded under the relevant laws, Longwave, PFSL and Pinnacle disclaim all liability to any person relying on the information contained in this communication in respect of any loss or damage (including consequential loss or damage), however caused, which may be suffered or arise directly or indirectly in respect of such information. This disclaimer extends to any entity that may distribute this communication.
Any opinions and forecasts reflect the judgment and assumptions of Longwave and its representatives on the basis of information available as at the date of publication and may later change without notice. Any projections contained in this presentation are estimates only and may not be realised in the future. Unauthorised use, copying, distribution, replication, posting, transmitting, publication, display, or reproduction in whole or in part of the information contained in this communication is prohibited without obtaining prior written permission from Longwave. Pinnacle and its associates may have interests in financial products and may receive fees from companies referred to during this communication.
This may contain the trade names or trademarks of various third parties, and if so, any such use is solely for illustrative purposes only. All product and company names are trademarks™ or registered® trademarks of their respective holders. Use of them does not imply any affiliation with, endorsement by, or association of any kind between them and Longwave.