
Positioning for a Small Cap Recovery.
– David Wanis, November 2022
We wrote about small caps and recessions in August and have repeatedly made the case that timing these things is fraught with risk relative to sticking with a disciplined investment program. Regardless, the number one question we get when talking with investors relates to timing small cap allocations in the face of a recession, and positioning for the eventual recovery so we have had another go at it.
From our prior note: The key conclusion, not surprisingly, is that small caps underperform large caps leading into an economic contraction. Given markets are forward looking, most of the underperformance (4-6% on average vs the market) comes six months prior to the contraction (recession) and usually co-incident with a pre-recession slowdown…. the strongest and most statistically significant part of the cycle for small cap returns is the post- recession recovery stage – which means if investors are going to try and time a recession and get out, they need to be confident of being able to get back in – which presents both a timing and liquidity challenge.
To give a more tangible example of what this is like to live through, we have looked at the past two recession driven periods of small cap underperformance in Australia to frame the drawdowns experienced and the time over which the adjustment happened. For some this may serve as a map to where we are today. We would repeat our belief that investors are better off sticking with their active manager program, and we will provide the evidence in this note as to why.
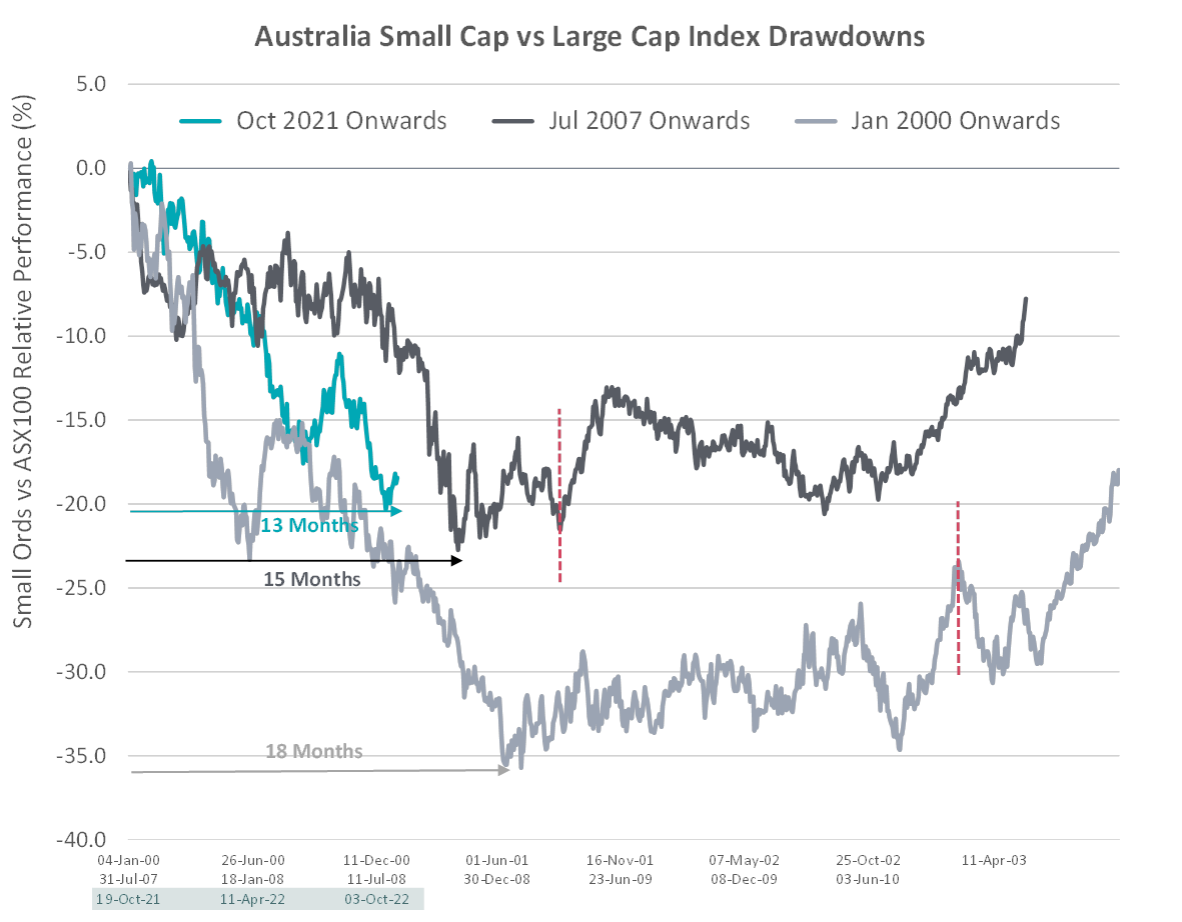
Source: Bloomberg. Dashed red line indicates when the overall market bottomed.
The first period we looked at was the post 2000 tech wreck, where fears of a recession resulted in the S&P / ASX Small Ordinaries Index (small caps) underperforming the S&P / ASX 100 Index (large caps) by 35%. This underperformance went for 18 months (to about June 2001) before stopping, after which small caps and large caps performed similarly. Interestingly small cap underperformance stopped well before the overall market bottomed (March 2003) indeed by the time the overall market low was reached, small caps had outperformed large caps by 10% since the June 2001 nadir.
The second period we looked at was the GFC, starting at the point of peak small cap outperformance (Jul 2007), the underperformance to large caps was almost 25% and took 15 months before stopping in October 2008. The overall market bottomed five months later in March 2009 at which point small caps had recovered a small amount of their underperformance to large caps.
To put the current small cap underperformance in this context, since the peak of small cap outperformance in early October 2021, the small cap index has underperformed large caps by 18.5% so far and this underperformance is around 13 months old. In both distance and time, we are likely at least through the halfway point, and possibly much closer to the end than the beginning. Few people we speak with share this view and for many it will likely be Q1 next year (15+ months from the peak) when people begin to consider re-allocating to small caps.
For anyone who didn’t live through the 2000-2003 period or 2007-2009 and believes the current period is somehow worse, we suggest going back and looking at what was happening in the world and in markets. It was a pretty rough time.
Active Investing Dominates in Small Caps for Good Reason
Why then are we so confident that investors are better off sticking with their active investment plan rather than trying to time the market given there are such large performance differences on offer?
The simple reason is that active small cap manager performance is not the same as the index, particularly in periods of steep underperformance.
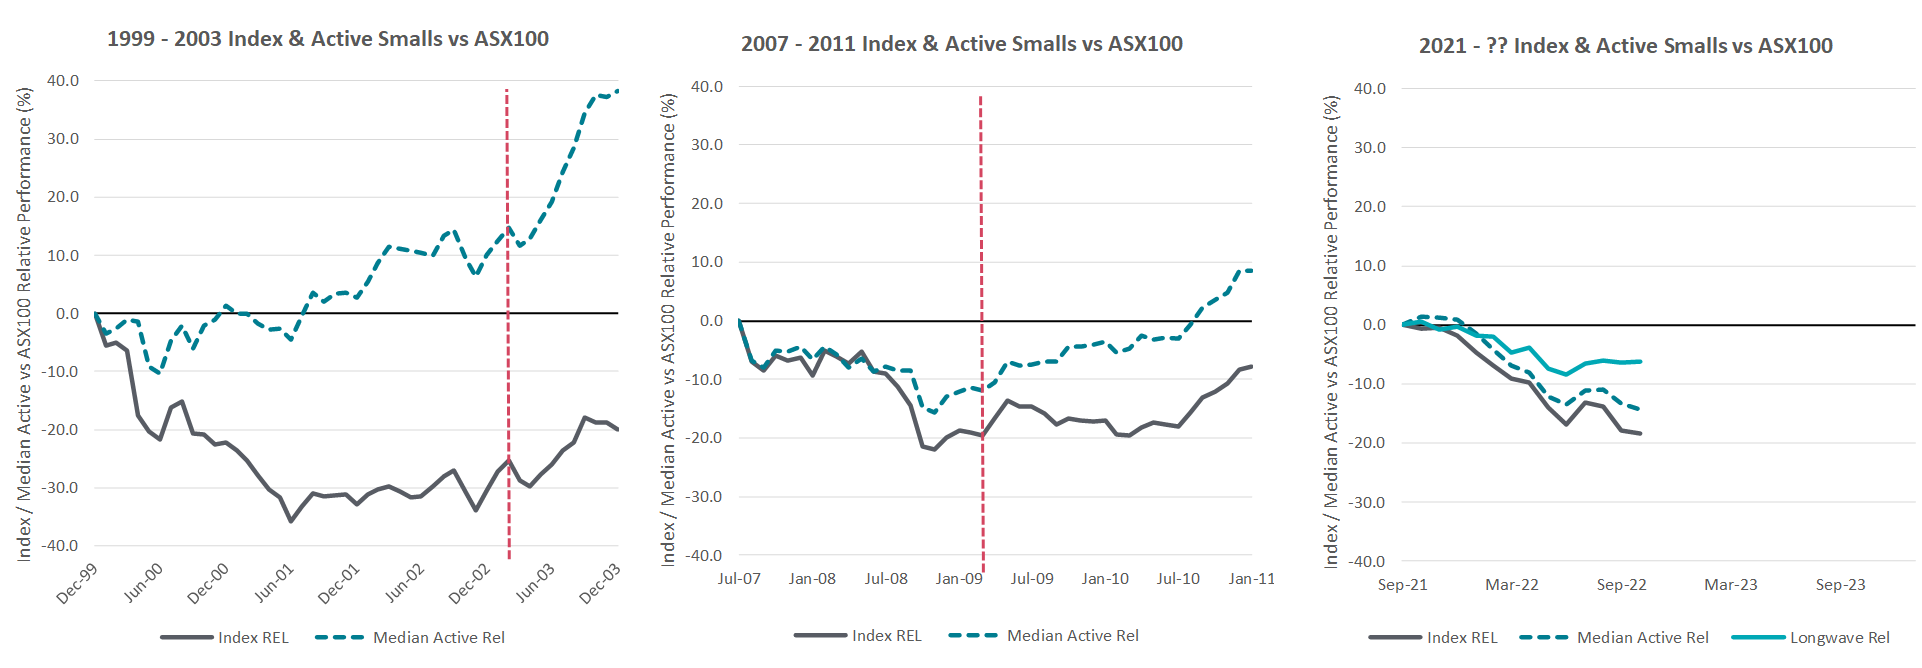
Source: Bloomberg, eVestment, Longwave Capital Partners. Dashed red line indicates when the overall market bottomed.
In our first example, unlike the index (35% underperformance over 18 months) the median active small cap manager only underperformed the large cap index by 10% and not only had this underperformance stopped after six months, but all underperformance was recovered at the 20-month mark. By the time the overall market bottomed in early 2003, the median active small cap manager was 15% ahead of the large cap index and would go on to see this outperformance accelerate during the broad market recovery.
In our second example, unlike the index (25% underperformance over 15 months) the median active small cap manager underperformed the large cap index by only 16% (although over the same period). All the large cap underperformance was recovered by September 2010 and outperformance again accelerated in the post GFC recovery.
Today we see a similar pattern. So far, the median manager has underperformed large caps by 14% (relative to the index at 18.5%). The Longwave strategy has only underperformed large caps by 6% since the peak in October 2021.
Investor focus continues to be on the downside risk of small caps. We think the aging of this re-pricing process means looking at positioning for recovery – or at least an end to small cap underperformance – maybe more fruitful. The outperformance of the index in a recovery, potentially added to by active alpha, may happen soon and if it does history suggests it will be significant. Or it may be years away and the index weighed down by too many low-quality stocks may struggle. Either way, staying disciplined, actively investing in quality and not trying to time a market for yesterday’s risks remains the most likely way investors will compound wealth from here.
Disclaimer
This communication is prepared by Longwave Capital Partners (‘Longwave’) (ABN 17 629 034 902), a corporate authorised representative (No. 1269404) of Pinnacle Investment Management Limited (‘Pinnacle’) (ABN 66 109 659 109, AFSL 322140) as the investment manager of Longwave Australian Small Companies Fund (ARSN 630 979 449) (‘the Fund’). Pinnacle Fund Services Limited (‘PFSL’) (ABN 29 082 494 362, AFSL 238371) is the product issuer of the Fund. PFSL is not licensed to provide financial product advice. PFSL is a wholly-owned subsidiary of the Pinnacle Investment Management Group Limited (‘Pinnacle’) (ABN 22 100 325 184). The Product Disclosure Statement (‘PDS’) and Target Market Determination (‘TMD’) of the Fund are available via the links below. Any potential investor should consider the PDS and TMD before deciding whether to acquire, or continue to hold units in, the Fund.
Link to the Product Disclosure Statement: WHT9368AU
Link to the Target Market Determination: WHT9368AU
For historic TMD’s please contact Pinnacle client service Phone 1300 010 311 or Email service@pinnacleinvestment.com
This communication is for general information only. It is not intended as a securities recommendation or statement of opinion intended to influence a person or persons in making a decision in relation to investment. It has been prepared without taking account of any person’s objectives, financial situation or needs. Any persons relying on this information should obtain professional advice before doing so. Past performance is for illustrative purposes only and is not indicative of future performance.
Whilst Longwave, PFSL and Pinnacle believe the information contained in this communication is reliable, no warranty is given as to its accuracy, reliability or completeness and persons relying on this information do so at their own risk. Subject to any liability which cannot be excluded under the relevant laws, Longwave, PFSL and Pinnacle disclaim all liability to any person relying on the information contained in this communication in respect of any loss or damage (including consequential loss or damage), however caused, which may be suffered or arise directly or indirectly in respect of such information. This disclaimer extends to any entity that may distribute this communication.
Any opinions and forecasts reflect the judgment and assumptions of Longwave and its representatives on the basis of information available as at the date of publication and may later change without notice. Any projections contained in this presentation are estimates only and may not be realised in the future. Unauthorised use, copying, distribution, replication, posting, transmitting, publication, display, or reproduction in whole or in part of the information contained in this communication is prohibited without obtaining prior written permission from Longwave. Pinnacle and its associates may have interests in financial products and may receive fees from companies referred to during this communication.
This may contain the trade names or trademarks of various third parties, and if so, any such use is solely for illustrative purposes only. All product and company names are trademarks™ or registered® trademarks of their respective holders. Use of them does not imply any affiliation with, endorsement by, or association of any kind between them and Longwave.