
The (poor) case for indexing small caps
The debate on active vs passive continues to create headaches for many categories of active managers – particularly in highly competitive parts of the market such as large caps. In large caps, 80-90% of managers underperform their index on a 10-year horizon, and the index itself has become even lower cost to own, with Large Cap ASX200 ETFs available to retail investors at 4 basis points (0.04%).
As persistent as the difficulty has been for large cap managers to outperform low-cost indices, there has been persistence in the ability for small cap managers to outperform their benchmarks. This can be observed both here in Australia and globally. The most popular survey for comparing these funds is the S&P Index vs Active analysis – or SPIVA. As robust as their methodology is in general, we do observe two biases in their small cap survey that overstate how well indexed small caps do against active managers.
The two major biases in the survey are:
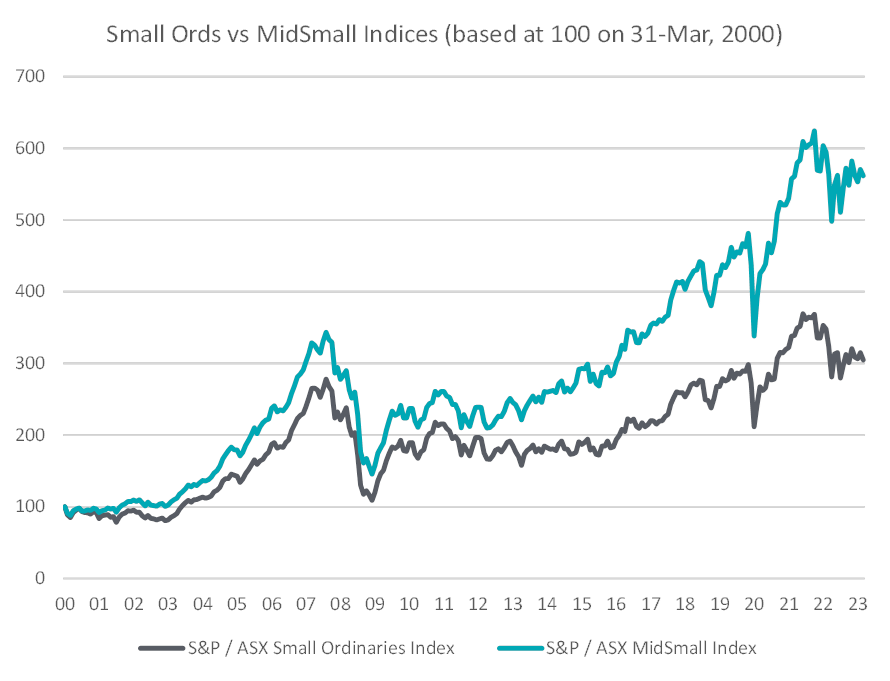
1) SPIVA compares small cap managers against the S&P / ASX Mid Small Index – which is a blend of small and midcaps. SPIVA take their active fund returns and categories from Morningstar. Active small cap funds are classified by Morningstar as Australia Fund Equity, Mid/Small (Value / Growth or Blend) – but the category benchmark applied to these funds by Morningstar is S&P/ASX Small Ordinaries index, not the S&P/ASX MidSmall index. This MidSmall index has outperformed the Small Ords Index by 2.9% per annum over the past 5 years, and by 3.8% per annum over the past over 10 years (to Dec 2022). MidSmall is probably not the most appropriate benchmark for the majority of the small cap funds they compare – although it would be for the few funds in the Australian Mid Cap category.
 2) SPIVA compares net of fee small cap fund returns against an index without any fee applied. This may be fair enough when comparing large cap funds as an investor can access the benchmark (in this case the S&P / ASX 200 Index) for 4bps. The only two available small cap index funds (ETFs) benchmarked to the S&P/ASX Small Ordinaries Index charge 50bps and 55bps respectively.
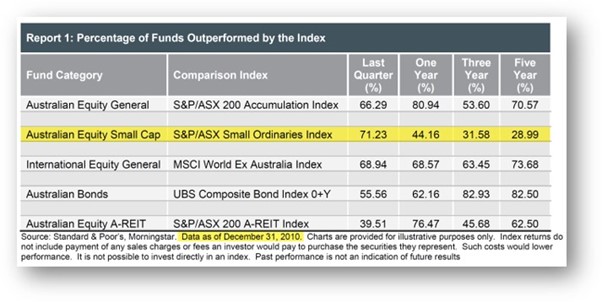
SPIVA switched indices in 2011 or 2012, but in 2010 the last scorecard using the Small Ords Index showed only 29% of active small cap funds underperforming the benchmark over 5 years. The difference between the MidSmall index and a Small Ords ETF net of fees is 3.4% p.a over five years and 4.3% p.a over ten years. Correcting for these, we think 60-70% of active small cap funds would outperform the appropriate, net of ETF fee index.
Globally we also see consistent SPIVA results where active small cap managers do better than the index. The bias of small cap index ETF costs is consistent in all markets (UK, Japan, Canada, India cost between 50 and 74bps). The exception to both performance and fees is the US, where small cap managers struggle (89% underperforming over 10 years), and where you can buy a small cap index ETF for 6bps.
What is different about small caps?
There are several reasons we believe active small cap managers can generate alpha in excess of their benchmarks in greater numbers than their large cap peers.
We have discussed these in detail before, but to summarise a few again:
Larger number of opportunities: Australian small cap investors are often choosing from hundreds, if not over 1,000 potential investment opportunities in their investible universe. Most large cap managers are limited to around 150 potential investments (the ASX 100 plus maybe 50 ex100 names).
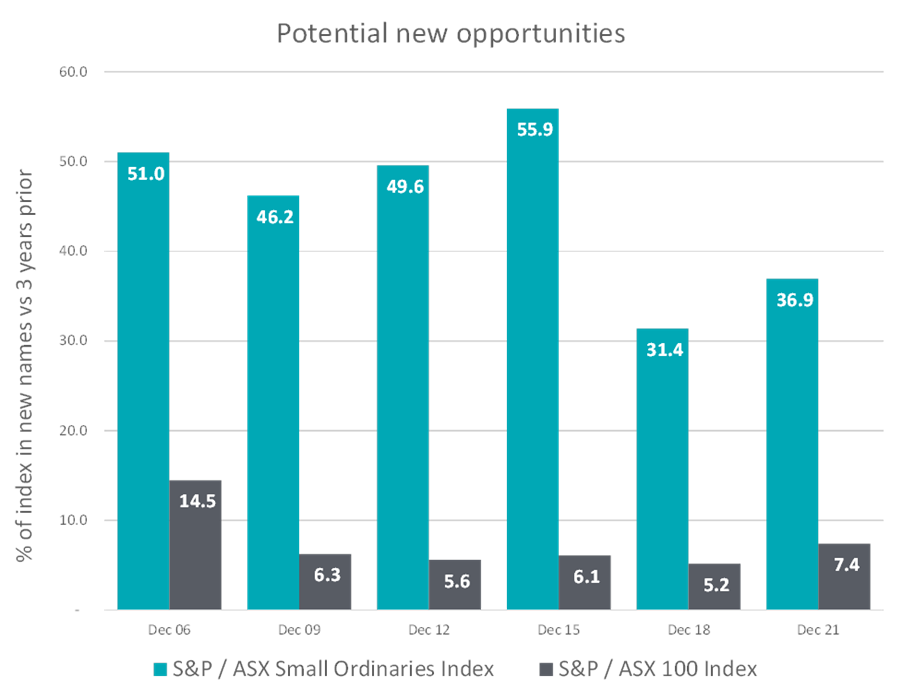
A much more dynamic market: Using the Small Ords and ASX100 indices as examples, we can see the difference in dynamics between market segments. Around 40% of the Small Ords index (by weight) changes over most three-year periods. New IPOs, microcaps moving up, new industries emerging, large caps moving down, demergers and spin-outs. On the same metric, less than 10% of the ASX100 is new between most three-year periods. It is a much more static universe.
Fewer investors chasing each opportunity: Using fund manager surveys as an example, there are more large cap funds in the market (probably three times as many as small cap funds) and each large cap investment team tends to be 2-3 times as large. This means there are 6-10x as many investors analysing large caps as there are small caps.
Putting these together, in large caps you have a market which is smaller, which doesn’t change much and has a very large number of highly sophisticated, intelligent and motivated competitors chasing alpha. Not surprisingly a sustainable edge here is hard to find. Small caps are the opposite – a very large market of opportunities, which is always changing and has a much smaller number of investors competing for ideas. The difference in competitive intensity is more than an order of magnitude between them.
Other differences in the small cap market include:
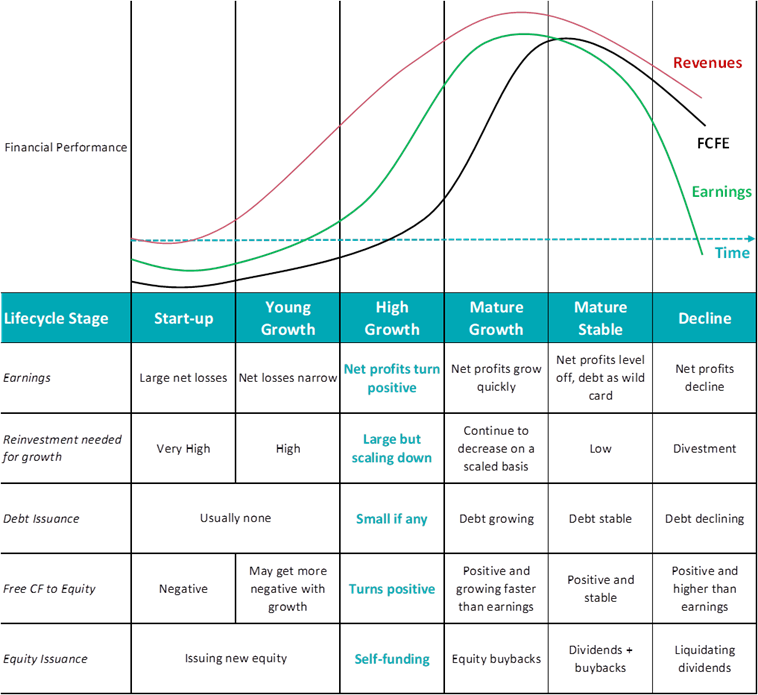
Small cap life cycle: As we discussed last month, small caps have a much earlier life cycle than large caps, with many included in the index before they have proven their business models and unit economics in a commercially viable and sustainable way. This makes failure and extremely negative performance a more common feature in small caps.
Higher small cap skew: as previously discussed, small caps have greater skew than large caps, and the drag of losers on portfolio returns (per the life cycle point above) is exacerbated in this market. This can sometimes be underestimated by large cap investors fishing in the small cap pond.
Disclaimer
This communication is prepared by Longwave Capital Partners (‘Longwave’) (ABN 17 629 034 902), a corporate authorised representative (No. 1269404) of Pinnacle Investment Management Limited (‘Pinnacle’) (ABN 66 109 659 109, AFSL 322140) as the investment manager of Longwave Australian Small Companies Fund (ARSN 630 979 449) (‘the Fund’). Pinnacle Fund Services Limited (‘PFSL’) (ABN 29 082 494 362, AFSL 238371) is the product issuer of the Fund. PFSL is not licensed to provide financial product advice. PFSL is a wholly-owned subsidiary of the Pinnacle Investment Management Group Limited (‘Pinnacle’) (ABN 22 100 325 184). The Product Disclosure Statement (‘PDS’) and Target Market Determination (‘TMD’) of the Fund are available via the links below. Any potential investor should consider the PDS and TMD before deciding whether to acquire, or continue to hold units in, the Fund.
Link to the Product Disclosure Statement: WHT9368AU
Link to the Target Market Determination: WHT9368AU
For historic TMD’s please contact Pinnacle client service Phone 1300 010 311 or Email service@pinnacleinvestment.com
This communication is for general information only. It is not intended as a securities recommendation or statement of opinion intended to influence a person or persons in making a decision in relation to investment. It has been prepared without taking account of any person’s objectives, financial situation or needs. Any persons relying on this information should obtain professional advice before doing so. Past performance is for illustrative purposes only and is not indicative of future performance.
Whilst Longwave, PFSL and Pinnacle believe the information contained in this communication is reliable, no warranty is given as to its accuracy, reliability or completeness and persons relying on this information do so at their own risk. Subject to any liability which cannot be excluded under the relevant laws, Longwave, PFSL and Pinnacle disclaim all liability to any person relying on the information contained in this communication in respect of any loss or damage (including consequential loss or damage), however caused, which may be suffered or arise directly or indirectly in respect of such information. This disclaimer extends to any entity that may distribute this communication.
Any opinions and forecasts reflect the judgment and assumptions of Longwave and its representatives on the basis of information available as at the date of publication and may later change without notice. Any projections contained in this presentation are estimates only and may not be realised in the future. Unauthorised use, copying, distribution, replication, posting, transmitting, publication, display, or reproduction in whole or in part of the information contained in this communication is prohibited without obtaining prior written permission from Longwave. Pinnacle and its associates may have interests in financial products and may receive fees from companies referred to during this communication.
This may contain the trade names or trademarks of various third parties, and if so, any such use is solely for illustrative purposes only. All product and company names are trademarks™ or registered® trademarks of their respective holders. Use of them does not imply any affiliation with, endorsement by, or association of any kind between them and Longwave.