
Quality is in the eye of the beholder
Investors must be endlessly frustrated by managers whose philosophy is labelled ‘Quality’. Value and growth are relatively standardised, supported by observable metrics and investors can quickly spot managers in those camps deviating from their stated goal. Quality, however, can be used to justify almost any investment a manager chooses to make, which risks rendering the term meaningless. We have seen junk small caps held by quality managers on the basis that in their view, at some point in the future, the business will demonstrate all the characteristics of a quality company.
This is a wonderful development. What makes a value or growth manager’s job in adding genuine value so hard is that once a style becomes easily defined, it can be algorithmically replicated. A true measure of a value manager’s alpha is not really relative to the broad market benchmark, it is more relevant to the naïve value index capturing much of their style bias. Part of why value investing perhaps used to work better was the behavioural fortitude required to invest against the crowd. A computer has no such reticence and will happily buy beat up, cheap stocks all day.
Quality being harder to define and pin down makes it less competitive and having a unique view on quality can be an advantage. Which brings us to resources. Many quality managers exclude commodity industries due to their inherent lack of pricing power. Taken to extremes, some quality investment processes become so narrow they resemble single sector funds, as the manager believes quality only exists in one or two places – like consumer or technology. Overall portfolio performance ends up dominated by sector influences and sacrifices a lot of diversification benefits. We think this is too narrow, and happily include resource stocks in our investment universe and quality resource stocks if we can find them, in our portfolio.
We can understand why many small cap investors exclude resources stock en-mass. A study we performed in late 2020 demonstrated over more than 15 years (from 2003 to 2020) the S&P/ASX Small Resource TR Index (small resources) underperformed the S&P/ASX Small Ordinaries TR Index (small ords) by 1.2% p.a. Simply by excluding resources and holding the S&P/ASX Small Industrials TR Index (small industrials) you could outperform the small ords by 0.6% p.a. More than this, not only did small resources drag returns, but the volatility was also horrendous: 29% p.a (vs 18% p.a for the small ords and 17% p.a for small industrials) and max drawdown was 20% greater as well. Seems like an open and shut case to exclude these stocks entirely.
Except the resources junk hides some gems. Quality businesses which can earn their place in the portfolio. Our research showed that quality small resources (our definition, applied consistently over time) outperformed the small ords handily (by more than 5% per annum) – although the high volatility and drawdown remained. Returns and volatility are one aspect of a stock’s role in a portfolio, but the other first principle consideration (often overlooked) is the correlation with the rest of the portfolio. This is where small resources shine.
When quality small resource stocks perform is sometimes exactly at the time other stocks are not working. Like in 2022. Having many different and uncorrelated sources of alpha from which to construct a portfolio gives us a fighting chance to deliver consistent performance.
Source: Factset, Company Accounts, Longwave Capital Partners
Current state of the small cap gold sector
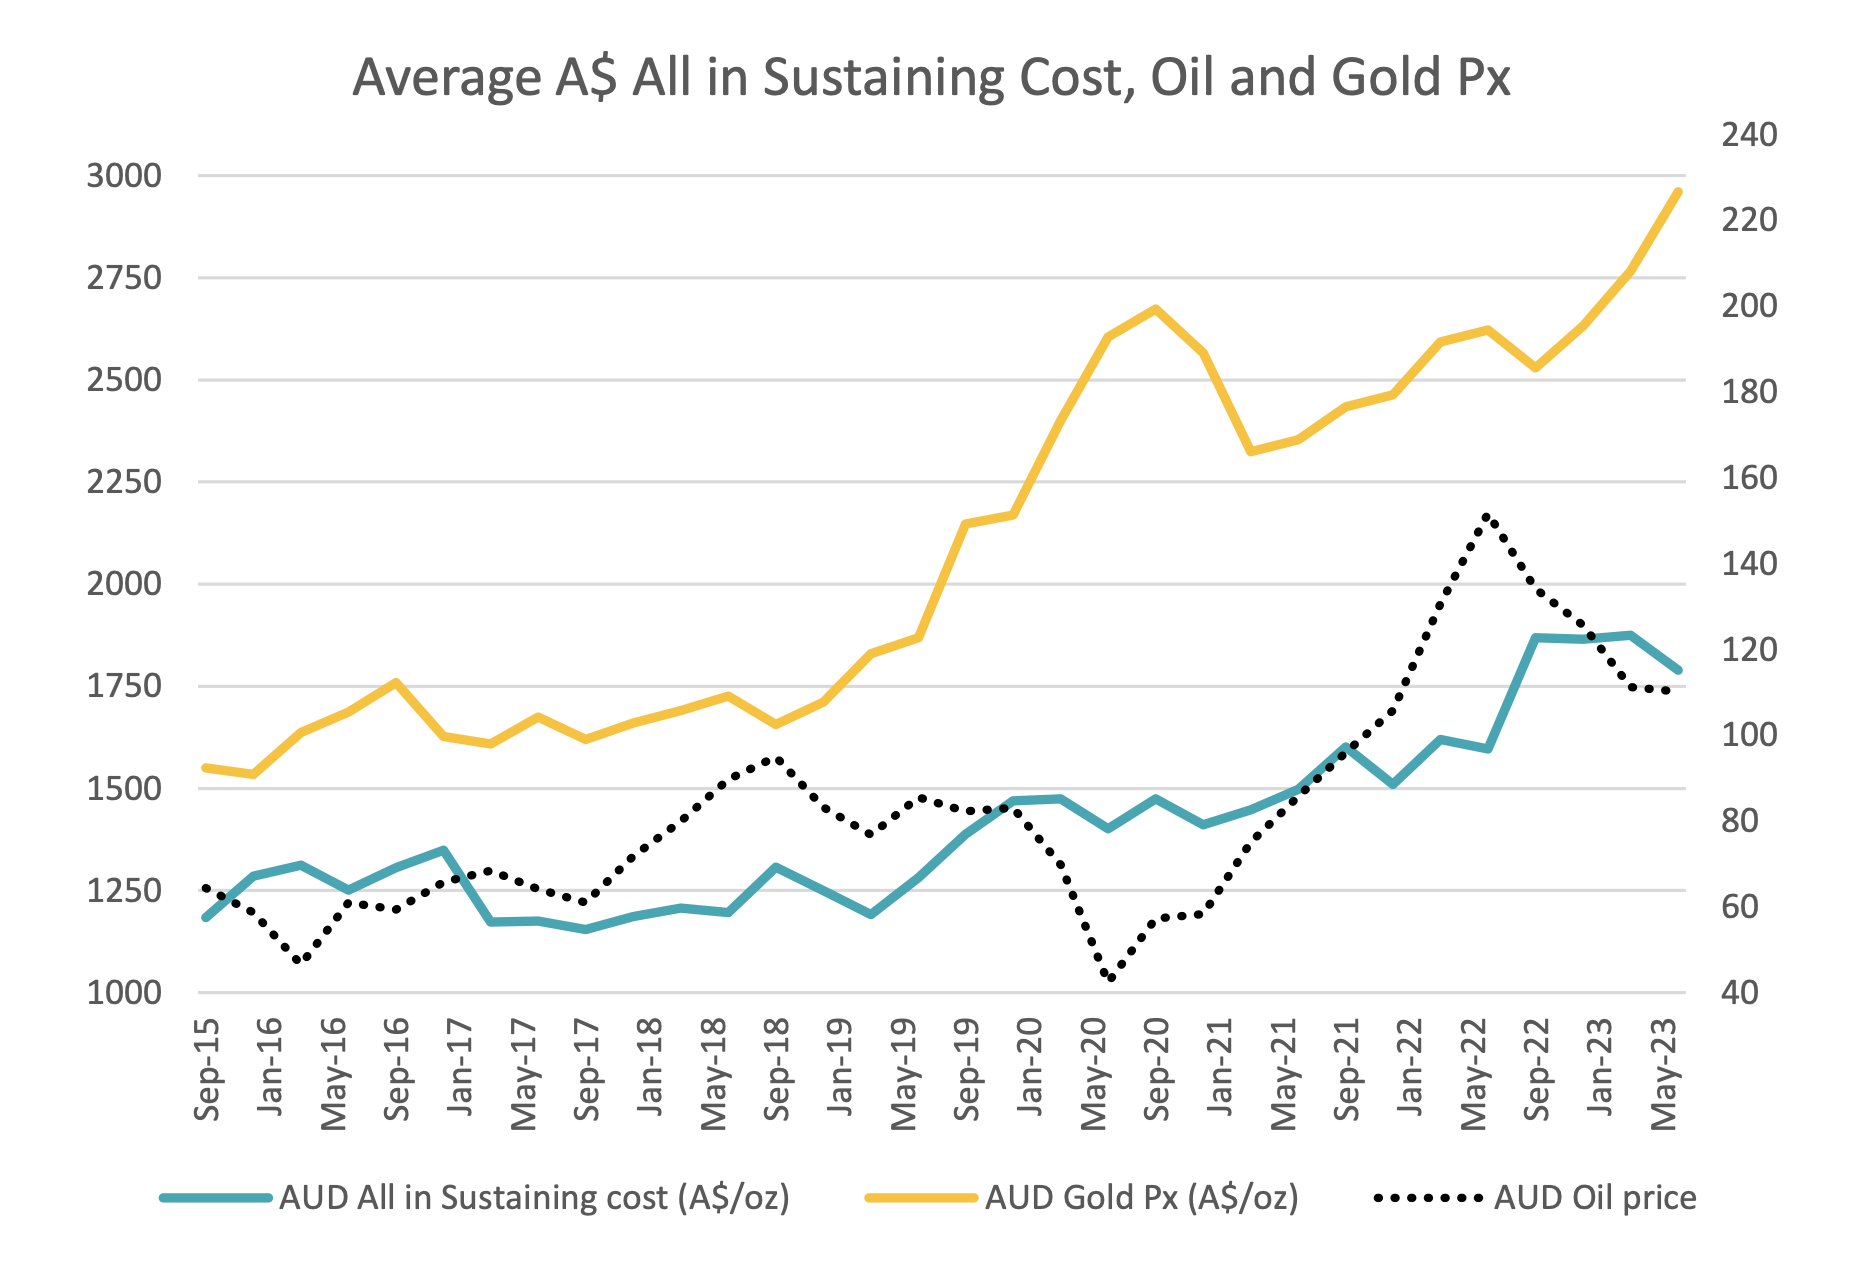
A decade ago, the picture for small cap gold companies was not encouraging. The A$ gold price had declined from a peak of around A$1,700 in late 2012 to under A$1,400 by mid 2014. It wasn’t only the commodity pricing environment that was bleak; balance sheets for most small cap gold miners were loaded with debt, and poor profitability was, if anything, overstated when using inconsistent management cash cost disclosure. In early 2014 the introduction of All-In Sustaining Cost (AISC) adopted across industry highlighted an even worse reality. Many companies were in the perilous position of carrying too much debt and delivering real cash losses.
Stock specific risk of failure was heightened across many names. From 2014 to 2016, companies focused on getting their true operating costs (AISC) to more sustainable levels and were fortunate enough to have a strong tail wind in the form of gold prices increasing from A$1,400 to A$1,600 over that period. Strong cash flow was used to pay down debt and many gold companies quickly got to net cash balance sheet positions. These fitter, better capitalised businesses then had the ongoing good fortune of seeing the A$ gold price continue to rise another 25% and set a record of A$2,000 / oz by June 2019 (rising US$ gold boosted by a falling AUDUSD exchange rate), driving margins, profits, cash flow and net cash even higher.
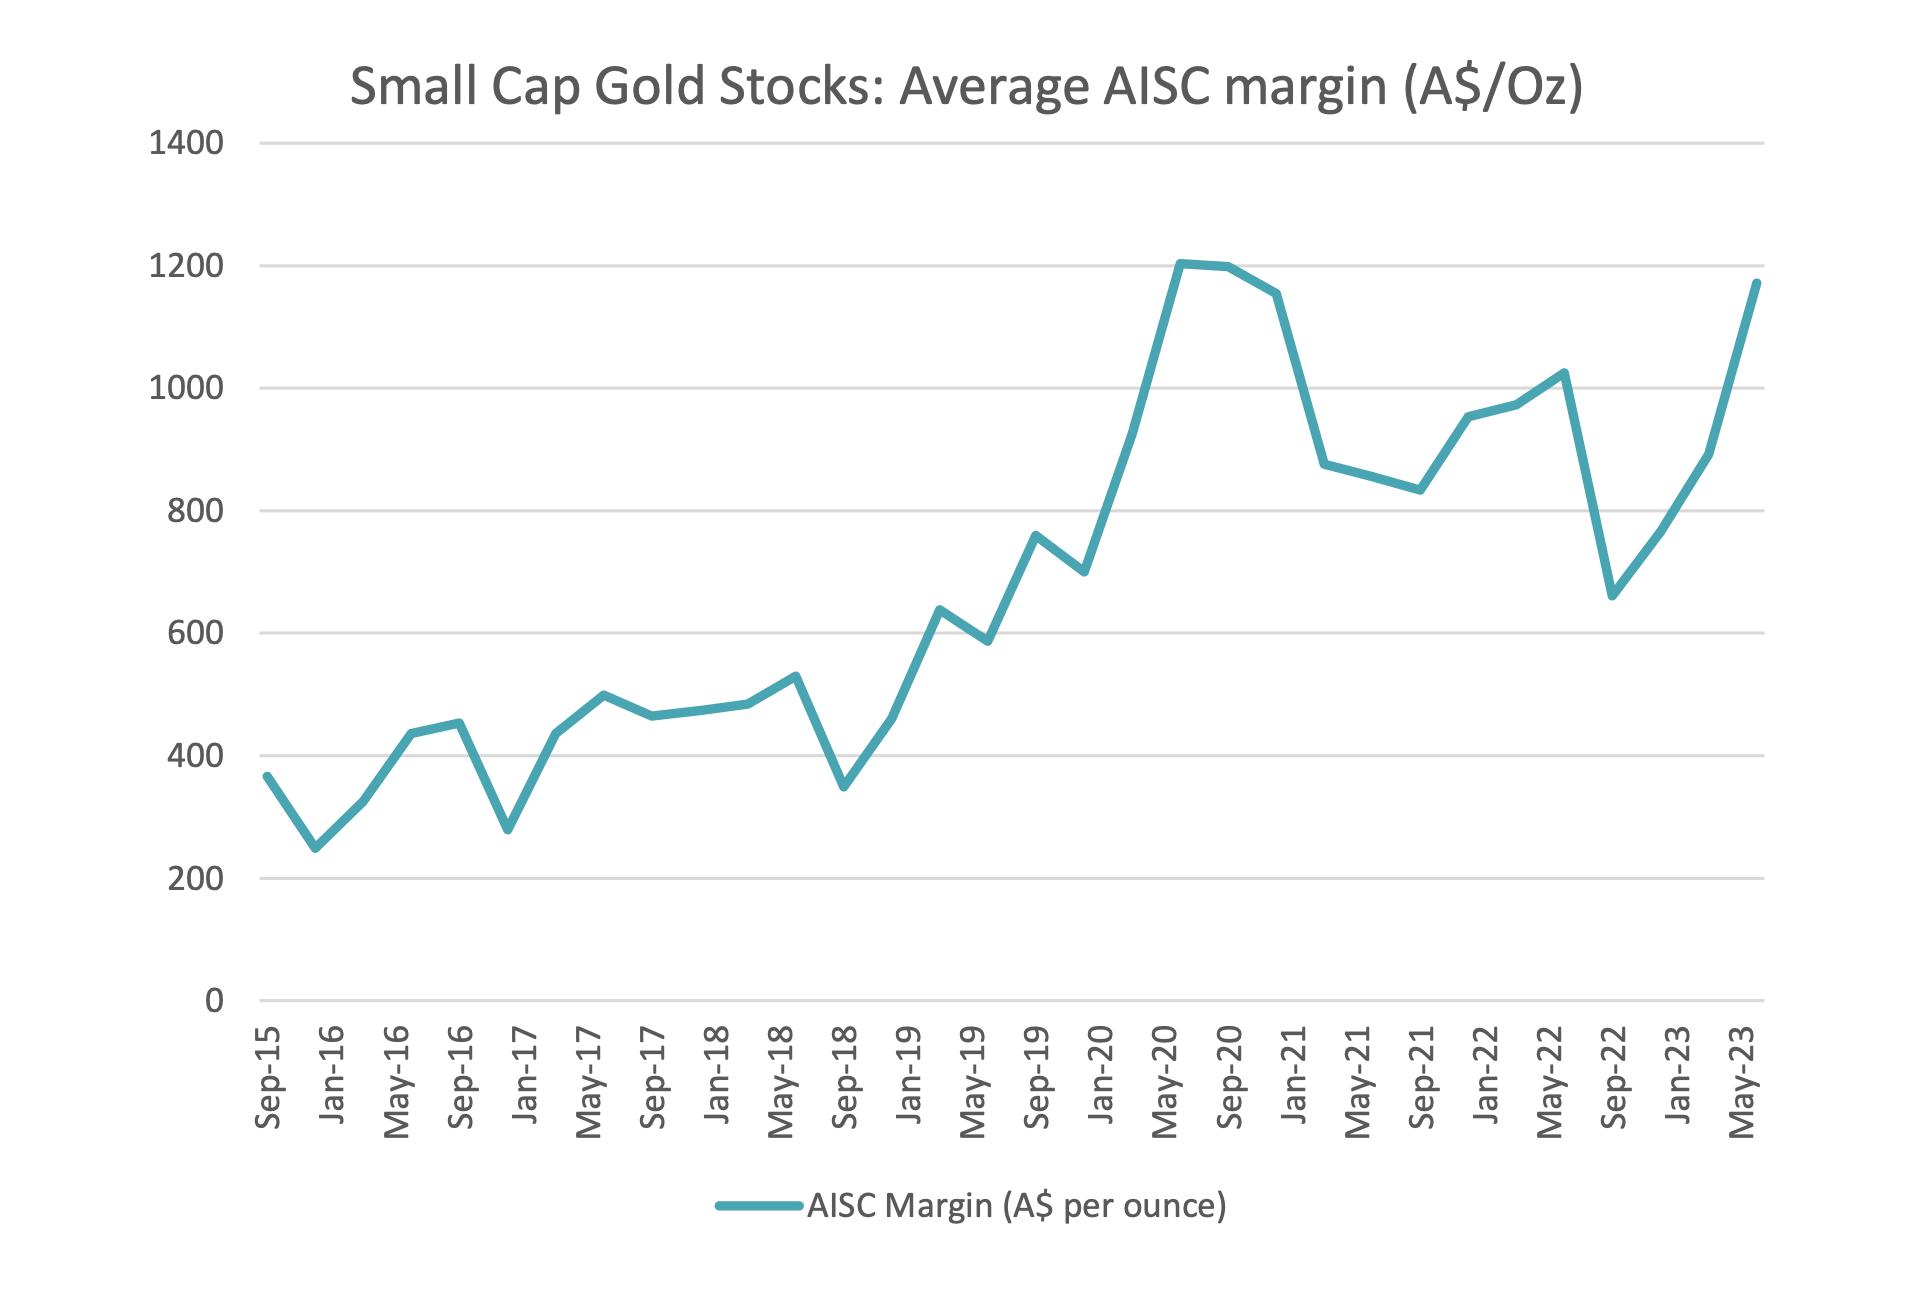
Despite continuing to operate during the pandemic, labour and travel restrictions saw average AISC across small-cap gold stocks rise from A$1300/oz to A$1500/oz in in the space of 2 quarters. A global flight to safety in assets, however saw AISC margins (the difference between $A/oz gold price and $A/oz AISC) rise to record levels by December of 2020. From a cash perspective, the stocks had become a relative gold-mine. A sharp rise in oil prices brought AISC margins back to A$650/oz but these have been on the rise again as the gold price has made new highs and All-in-sustaining costs have stabilized. ASIC margins for the small-cap gold stocks as a whole are now some 200% above where they were in 2015. These record ASIC margins should continue to generate cashflow for businesses that already have healthy balance sheets. The next phase for small cap gold companies will be interesting to watch, but we believe management teams are likely to remember the lessons of the early 2010’s and shareholders will continue to see the benefits of the discipline learned during that era.
Source: Factset, Company Accounts, Longwave Capital Partners
Disclaimer
This communication is prepared by Longwave Capital Partners (‘Longwave’) (ABN 17 629 034 902), a corporate authorised representative (No. 1269404) of Pinnacle Investment Management Limited (‘Pinnacle’) (ABN 66 109 659 109, AFSL 322140) as the investment manager of Longwave Australian Small Companies Fund (ARSN 630 979 449) (‘the Fund’). Pinnacle Fund Services Limited (‘PFSL’) (ABN 29 082 494 362, AFSL 238371) is the product issuer of the Fund. PFSL is not licensed to provide financial product advice. PFSL is a wholly-owned subsidiary of the Pinnacle Investment Management Group Limited (‘Pinnacle’) (ABN 22 100 325 184). The Product Disclosure Statement (‘PDS’) and Target Market Determination (‘TMD’) of the Fund are available via the links below. Any potential investor should consider the PDS and TMD before deciding whether to acquire, or continue to hold units in, the Fund.
Link to the Product Disclosure Statement: WHT9368AU
Link to the Target Market Determination: WHT9368AU
For historic TMD’s please contact Pinnacle client service Phone 1300 010 311 or Email service@pinnacleinvestment.com
This communication is for general information only. It is not intended as a securities recommendation or statement of opinion intended to influence a person or persons in making a decision in relation to investment. It has been prepared without taking account of any person’s objectives, financial situation or needs. Any persons relying on this information should obtain professional advice before doing so. Past performance is for illustrative purposes only and is not indicative of future performance.
Whilst Longwave, PFSL and Pinnacle believe the information contained in this communication is reliable, no warranty is given as to its accuracy, reliability or completeness and persons relying on this information do so at their own risk. Subject to any liability which cannot be excluded under the relevant laws, Longwave, PFSL and Pinnacle disclaim all liability to any person relying on the information contained in this communication in respect of any loss or damage (including consequential loss or damage), however caused, which may be suffered or arise directly or indirectly in respect of such information. This disclaimer extends to any entity that may distribute this communication.
Any opinions and forecasts reflect the judgment and assumptions of Longwave and its representatives on the basis of information available as at the date of publication and may later change without notice. Any projections contained in this presentation are estimates only and may not be realised in the future. Unauthorised use, copying, distribution, replication, posting, transmitting, publication, display, or reproduction in whole or in part of the information contained in this communication is prohibited without obtaining prior written permission from Longwave. Pinnacle and its associates may have interests in financial products and may receive fees from companies referred to during this communication.
This may contain the trade names or trademarks of various third parties, and if so, any such use is solely for illustrative purposes only. All product and company names are trademarks™ or registered® trademarks of their respective holders. Use of them does not imply any affiliation with, endorsement by, or association of any kind between them and Longwave.