
Measuring climate change impacts: Carbon shareholder value at risk.
– Melinda White, October 2022
In the last six months, we have been working on upgrading our climate change tools. The first step in this exercise is a Carbon Value at Risk dashboard. With the potential advent of an EU carbon-import tax and the change of government in Australia, it’s become increasingly important that we understand the potential impact of the cost of carbon on the operating metrics of the companies we hold in our portfolio. Although it seems remote today, as each year progresses with little bending in the curve of global GHG emissions, we are inevitably approaching what we think of as decision step-points for policy makers.
We have a very simple mental model of the net-zero task.
- There is an upper limit of total cumulative CO2 equivalent greenhouse gasses that the atmosphere can hold beyond which, mean global surface temperatures will rise above certain points. The IPCC talks in terms of +1.5°C, +6°C etc. This is referred to as the carbon budget.
Scientists agree that if the total CO2 equivalent in the atmosphere is limited to 430-480ppm (parts per million) in the future, the atmosphere is likely to only warm by 1.5 degrees. 480-530ppm CO2 equivalent in the atmosphere will be 2.6 degrees warming.1
- Annual CO2 emissions get us closer and closer to the carbon budget each year. If the current annual rate of emissions held steady for the next 8 years, we would reach the total carbon budget for +1.5°C warming. If the current annual rate of emissions held steady for the next 25 years, we would reach the total carbon budget for +6°C warming.
- Quite clearly we need to de-link carbon emissions from global growth (bend the curve), then reduce very quickly each year until they are zero in 2050. Even then, we are still likely to see significant impacts from a +1.5°C – +2.0°C warming.
The interplay of these three elements is what leads us to believe there will be step-points for policy makers in the next 10 years. Although there’s been a lot of commitments to net zero over the last 10 years, it hasn’t been enough to even bend the curve, let alone start the decline path.
To date, we can see from the following graph that annual emissions since the start of the industrial revolution haven’t held steady, they’ve grown in-line with GDP growth. What this graph also shows (pink lines) is how fast the rate of annual emissions has to decline for each starting year. You can see that the steepness of decline is significant if we aim to achieve +2.0°C warming but only bend the curve starting in 2022.
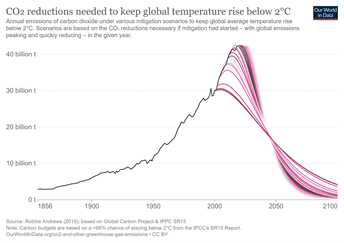
Every year carbon emissions continue to grow (or the curve doesn’t bend), means heavier lifting (or faster transition) at the back-end of the 2030-2050 period. Knowing what we do (as fundamental investors) about the various incentives, behaviour and decision frameworks that exist through global asset bases (buildings, fleet, cars, manufacturing processes, factories, residential housing), we are sceptical that an incentive-lite approach will lead to an economically plausible pathway to net-zero in the time-frames currently talked about. In short, without policy pivots and prices on carbon to incentivise a faster capital replacement cycle, we believe the world is unlikely to meet the targets.
With that context, we’ve been considering how we can approach understanding the risk of carbon pricing in our portfolios, but also how capital allocators can meaningfully approach and measure their role in transition. To date, the view about the role of capital markets in transition has been to simply synthetically ‘decarbonise’ portfolios by selling CO2e-heavy assets and buying CO2e-lite assets. At the margin this does appear to have increased the cost of capital for new or replacement fossil fuel projects. However, it also ignores the fact that CO2e-heavy assets are the ones that need the most amount of capital investment to transition. It also ignores the fact that capital allocators have an essential role to play in influencing the decision to use their marginal dollar of reinvested capital to speed up transition. We often hear people say ‘I’ll invest when its economically sensible to do so’. This ignores the fact that waiting to invest when the NPV is positive could cost the earth. Literally.
With this in mind, we want to first understand the immediate risks to the portfolio and individual stock holdings if carbon were to be suddenly priced. We call this Carbon Value at Risk (Carbon VAR). The next step will be to understand how much of our portfolio’s incremental capital is being reinvested to lower carbon emissions, this is a project for 2023.
Carbon Value at Risk is a simple backward looking (theoretical) exercise that asks the question;
“if every company in our portfolio had to pay for its carbon emissions, how much value destruction would that create?”
And are there any flow-on effects (debt metrics).
A couple of caveats: we are using scope 1 & 2 emissions data as we are confident that where estimations are made, the models for estimation are reliable and robust. We suspect that in certain cases, this analysis for scope 3 emissions may look quite different and we will continue to watch for the time when we can use more reliable scope 3 data to incorporate in the analysis.
We have not assumed that any individual companies have the ability to pass through the impact of the cost of carbon. Although this is a widely accepted methodology, we wanted to start by understanding the worst-case. Over time, we may be able to incorporate an individual stock-level elasticity factor to the analysis. But this will require some work at the bottom-up level.
At first pass, the exercise seems simple enough; with a price on carbon, a company’s carbon emissions become an additional cost in the P&L. It will naturally lower EBITDA. However, given the wide differences in the dollar value of P&L items between EBITDA and NPBT, as fastidious old-school investors, we felt it necessary to recalculate every line item down to NPBT.
At the stock level, we are taking last financial year reported data (FY0) and the latest reported scope 1 & 2 carbon emissions CO2e (equivalent) and then recalculating every line item below revenue for the additional cost of carbon. We then assume that the current last-12-month (LTM) Price/NPBT on the stock remains unchanged to derive a new, CO2e-adjusted stock price. Finally, we recalculate the NAV of the portfolio using those new prices. We are then able to compare current portfolio NAV to the potential impact on NAV at different carbon prices.
In addition to recalculating the P&L, we also recalculate the cashflow statement and its impact on debt. This allows us to visualise whether a company’s balance sheet is likely to end up in distress under certain carbon cost regimes and, whether a company would fail our investment process leverage threshold under certain conditions.
We are able to run this exercise for any carbon price, but for the time being, we chose a range from $10 (we think a plausible lower bound policy makers might consider as an opening gambit) and $90 (the widely accepted price economists think is needed to increase the velocity of capital replacement).
Portfolio Observations
So how does our portfolio (end September quarter) stack up under this range of scenarios?
-
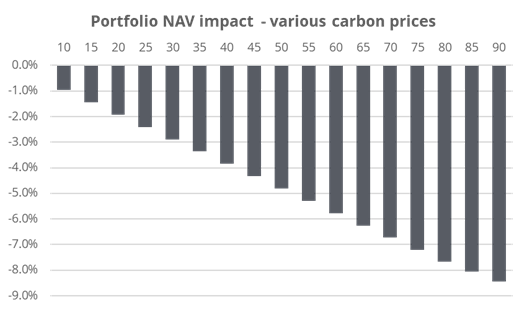
The impact on overall portfolio NAV (all else being equal) is smaller than we first thought. At a $90 carbon price the change in portfolio value is around -8%.
 Source: Longwave
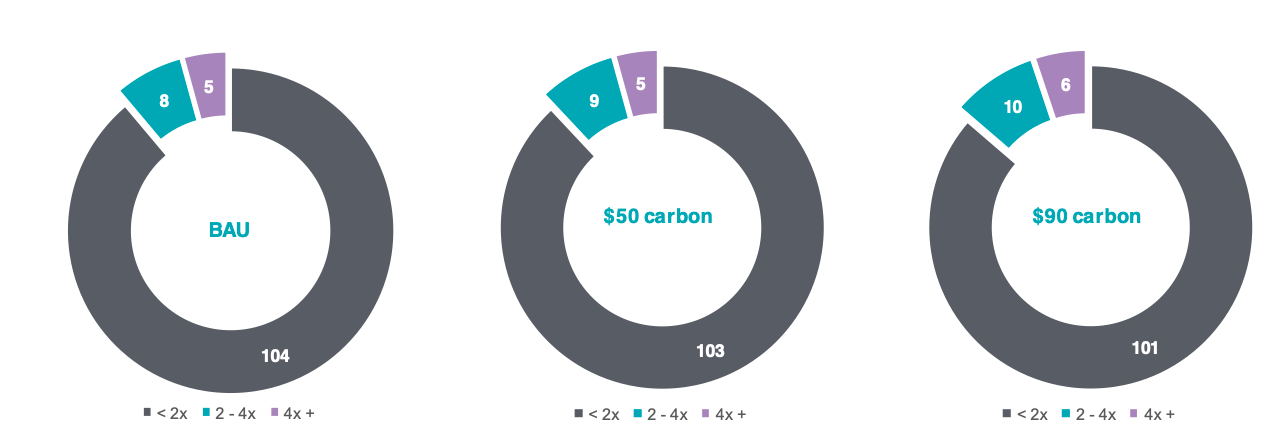
 - The indebtedness of our portfolio companies doesn’t move much between BAU and $90 carbon. The number of stocks with gross debt / EBITDA of greater than 4x increases by 1.
Source: Longwave
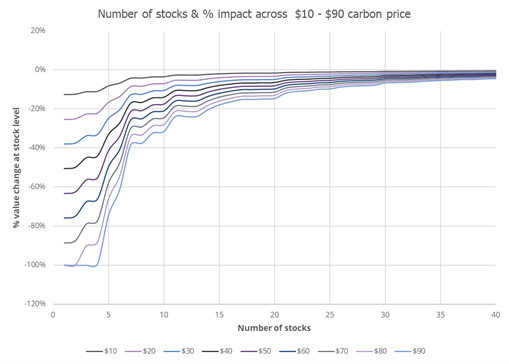
Across all carbon prices, the larger valuation impacts are limited to a handful of stocks out of our portfolio of approximately 120 stocks. The dispersion of valuation impacts narrows quickly between the 10th and 25th stock. Thus, even at a $90 carbon price, by the time we reach the 20th most impacted stock, the dispersion in valuation impact falls to -10%.
Source: Longwave
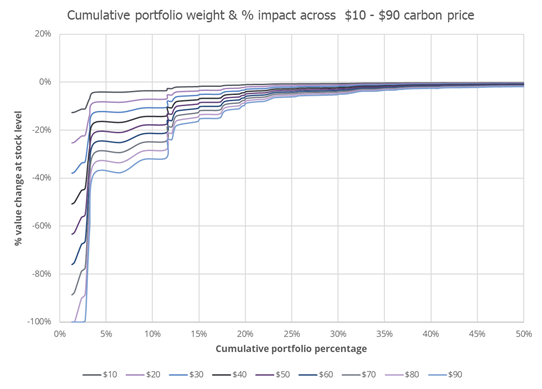
Looking at the portfolio in a different way, we can see that by the time we reach 20% cumulative portfolio weight, the dispersion in valuation impacts ranges from -1.2% ($10 carbon price) to -10% ($90 carbon price).
 Source: Longwave
Stock level observations
We’ve learnt a couple of really interesting things as a result of building our carbon VAR tool in-house and from the bottom-up.
A company’s carbon footprint isn’t the only determinant of valuation impact. Rather, it’s the relationship between the carbon footprint and the margins of the business. A low margin business with mid-size carbon footprint may see a bigger impact to EBIT and NPAT than a business with high EBIT margins and a large carbon footprint.
Interestingly, a number of hard-rock mining names (not coal miners) are in the bucket of 20 stocks most impacted. These mining stocks run large truck fleets and processing plants on diesel power, but most of them also have lower grade open-pit operations. Again, the relationship between the business operations, commodity price and carbon footprint is obvious once we observe the data, but without doing the exercise we may not have been cognisant of it.
It’s not just coal stocks or mining stocks that can be heavily impacted. A logistics-driven business (with a large fuel bill) and low EBIT margin can suffer catastrophic cost increases that drive the valuation to zero under a $90 carbon price. Likewise, a small company with a very average carbon footprint can see a large loss in value if it has very low margins. If we think about this in the context of the types of businesses we see in the small-cap space; this could mean a business that was just transitioning to profitability, but had a medium-size carbon footprint could easily be tipped back into loss making territory if carbon were to be priced.
Applying the data
For most fundamental managers, this type of Value at Risk tool is largely theoretical. Its more preparation for a risk event rather than applicable right now. However, we believe Longwave could use adjusted data from our carbon VAR tool to construct portfolios protected from any specific carbon price scenario. We will seek to do more work on this in the near future and share the results.
Download the complete ESG Observations and FY2022 Proxy Voting Report
1 IPCC, 2014: Climate Change 2014: Synthesis Report. Contribution of Working Groups I, II and III to the Fifth Assessment Report of the Intergovernmental Panel on Climate Change [Core Writing Team, R.K. Pachauri and L.A. Meyer (eds.)]. IPCC, Geneva, Switzerland, 151 pp.
Disclaimer
This communication is prepared by Longwave Capital Partners (‘Longwave’) (ABN 17 629 034 902), a corporate authorised representative (No. 1269404) of Pinnacle Investment Management Limited (‘Pinnacle’) (ABN 66 109 659 109, AFSL 322140) as the investment manager of Longwave Australian Small Companies Fund (ARSN 630 979 449) (‘the Fund’). Pinnacle Fund Services Limited (‘PFSL’) (ABN 29 082 494 362, AFSL 238371) is the product issuer of the Fund. PFSL is not licensed to provide financial product advice. PFSL is a wholly-owned subsidiary of the Pinnacle Investment Management Group Limited (‘Pinnacle’) (ABN 22 100 325 184). The Product Disclosure Statement (‘PDS’) and Target Market Determination (‘TMD’) of the Fund are available via the links below. Any potential investor should consider the PDS and TMD before deciding whether to acquire, or continue to hold units in, the Fund.
Link to the Product Disclosure Statement: WHT9368AU
Link to the Target Market Determination: WHT9368AU
For historic TMD’s please contact Pinnacle client service Phone 1300 010 311 or Email service@pinnacleinvestment.com
This communication is for general information only. It is not intended as a securities recommendation or statement of opinion intended to influence a person or persons in making a decision in relation to investment. It has been prepared without taking account of any person’s objectives, financial situation or needs. Any persons relying on this information should obtain professional advice before doing so. Past performance is for illustrative purposes only and is not indicative of future performance.
Whilst Longwave, PFSL and Pinnacle believe the information contained in this communication is reliable, no warranty is given as to its accuracy, reliability or completeness and persons relying on this information do so at their own risk. Subject to any liability which cannot be excluded under the relevant laws, Longwave, PFSL and Pinnacle disclaim all liability to any person relying on the information contained in this communication in respect of any loss or damage (including consequential loss or damage), however caused, which may be suffered or arise directly or indirectly in respect of such information. This disclaimer extends to any entity that may distribute this communication.
Any opinions and forecasts reflect the judgment and assumptions of Longwave and its representatives on the basis of information available as at the date of publication and may later change without notice. Any projections contained in this presentation are estimates only and may not be realised in the future. Unauthorised use, copying, distribution, replication, posting, transmitting, publication, display, or reproduction in whole or in part of the information contained in this communication is prohibited without obtaining prior written permission from Longwave. Pinnacle and its associates may have interests in financial products and may receive fees from companies referred to during this communication.
This may contain the trade names or trademarks of various third parties, and if so, any such use is solely for illustrative purposes only. All product and company names are trademarks™ or registered® trademarks of their respective holders. Use of them does not imply any affiliation with, endorsement by, or association of any kind between them and Longwave.