
Can We do Well by Being Good?
– David Wanis, July 2021
Classical capital allocation theory suggests constraining a portfolio must be sub-optimal. Imposing a higher cost of capital on ‘bad’ companies, by definition, increases the return hurdle and as such the return generated by these stocks. Ergo, penalising bad governance practices through a higher discount rate and removing them from your portfolio you must be willing to accept a lower return.
This may hold in theory, where the market is static and all actors are rational with fixed preferences, however we think dynamic markets, reflexive behaviour, shifting investor preferences and the transition period of adjusting discount rates mean the reality we observe (and are currently observing) may be very different. This may also explain why results from a back test conducted during a transition period may be misleading and why we are currently observing outperformance from ESG factors where theory suggests the reverse.
We have built a simple toy model to explore these issues.
Let us assume we have three companies – average, good and bad as measured by their ESG behaviour but in every other way the same. To date, the market has not cared about ESG and is only interested in financial performance. As such, the equity discount rate for each is the same (10%) and the discounting of their compounding free cash growth of 5% per annum results in all three being valued at $14.
Exhibit 1: ESG impacts through the valuation channel

Source: Foundations of ESG Investing: How ESG Affects Equity Valuation, Risk, and Performance. Guido Giese, Linda-Eling Lee, Dimitris Melas, Zoltán Nagy, and Laura Nishikawa July 2019
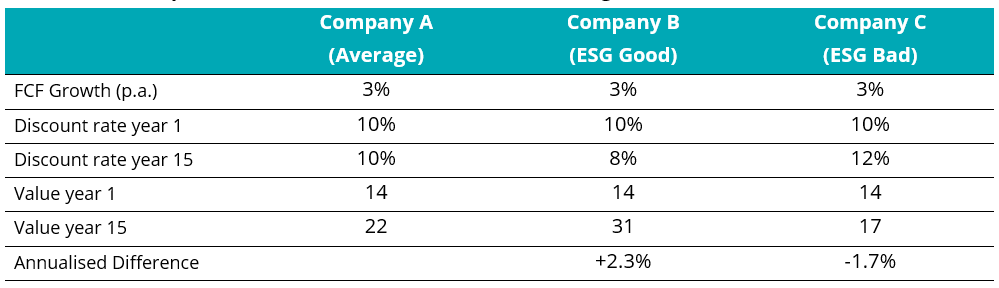
The market state then changes, where the marginal investor values the ESG behaviour and allocates capital using discount rates reflecting this view – in our model this reduces the discount rate for the ESG Good company (from 10% to 8%) and increases the discount rate for the ESG Bad company (from 10% to 12%). This doesn’t happen immediately as only the marginal investor has changed their allocation model, but we assume it does occur gradually across all investors over a 15 year period.
The result by year 15 (remembering we have the same expected free cash flow stream forecast for all companies) the value of Company B (ESG Good) has increased by 2.3% per annum faster than Company A (Average) and Company C (ESG Bad) has increased by 1.7% per annum slower. This 4% per annum spread between Company B and Company C is what is observed by investors over 15 years as the market adjusts to the new discount rates.
So yes, assuming the market currently has not already completely adjusted to new, ESG aware discount rates, investors can for a long period of time do well by doing good.
The argument about higher returns (due to higher discount rates) from the bad ESG company may hold true – but it is true from year 15, not year one if we are starting at a lower discount rate.
Cash flow impacts
Exhibit 2: ESG impacts through the cash flow channel

Source: Foundations of ESG Investing: How ESG Affects Equity Valuation, Risk, and Performance. Guido Giese, Linda-Eling Lee, Dimitris Melas, Zoltán Nagy, and Laura Nishikawa July 2019
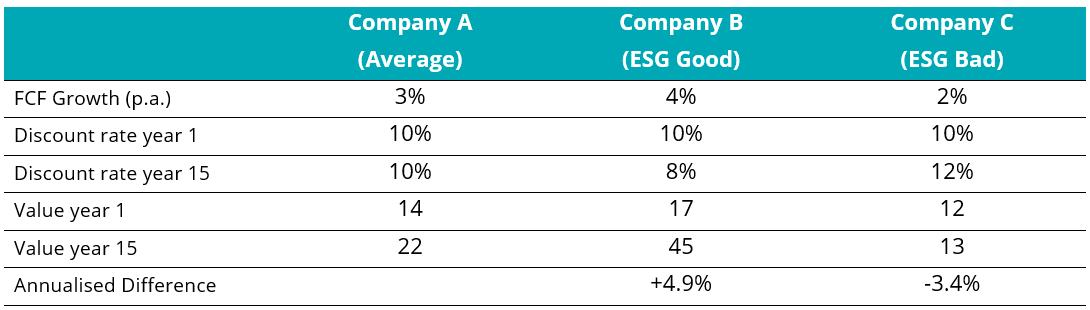
There are other factors potentially influencing company cash flows over time. Company B (ESG Good) may see improved financial performance through less fraud, lower employee turnover, increased consumer demand etc. Company C (ESG Bad) may suffer from increased regulation, fines for malfeasance, higher employee turnover and decreased consumer demand etc. As investors start to appreciate the relationship between ESG and financial performance, investor cash flow forecast expectations may also shift.
If this resulted in a 1% per annum increase in the FCF growth of Company B and a 1% per annum decreased for Company C, the difference in annual valuation shift (from Company A) goes from 4% per annum to over 8% per annum.
This is not novel. We have observed many times in markets where significant changes in investor preferences, expressed through discount rates, has a meaningful impact on returns through long transition periods. Think about the change in demand from long term, non-tax paying superannuation funds and the impact they have had on how illiquid property and infrastructure has been priced over the past 25 years. Or perhaps how the share of assets invested passively has changed the marginal pricing of securities included in vs excluded from indices.
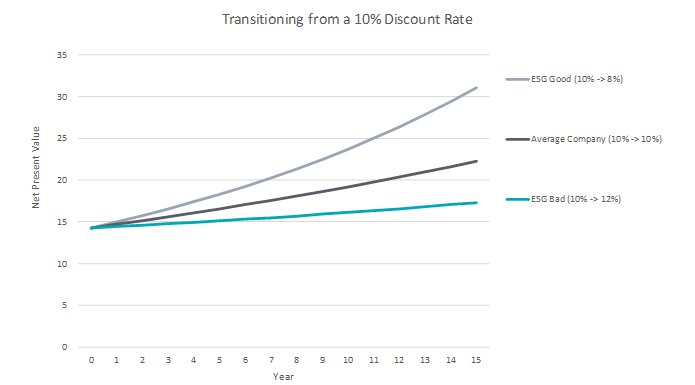
Exhibit 3: The impact of a transition in discount rates through time.
Source: Longwave Capital Partners
Exhibit 4: Valuation impact of transitioning to ESG influenced discount rates
Source: Longwave Capital Partners
Exhibit 5: The impact of a transition in discount rates and changes in cash flow growth through time.
Source: Longwave Capital Partners
An alternative explanation: ESG performance reflects sector tilts
Because the time period of available ESG data is so short, there are plausible alternative explanations to the marginal discount rate theory for the performance we are currently observing.
Exhibit 6: Sector representation in ESG portfolios
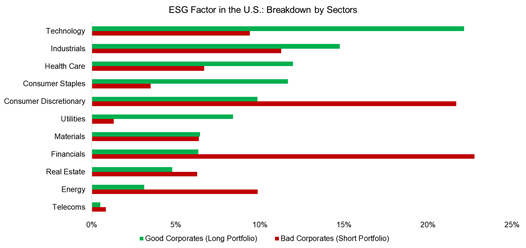
Source: FactorResearch
One reasonable explanation over the past decade may be sector skew. The way ESG factors are currently calculated is far more punitive to certain sectors. An ESG tilted portfolio would be long technology, industrials, healthcare and consumer staples and short energy, real estate, financials and materials. The long sectors have happened to outperform the short sectors over the past 5-10 years.
Exhibit 7 below highlights factor based research which initially looks like ESG is a new source of excess return once exposure to traditional factors has been accounted for (value, size, momentum, quality, low volatility). However once the sector tilts are controlled, the residual returns from ESG are pretty much zero.
Exhibit 7: Residual ESG Performance
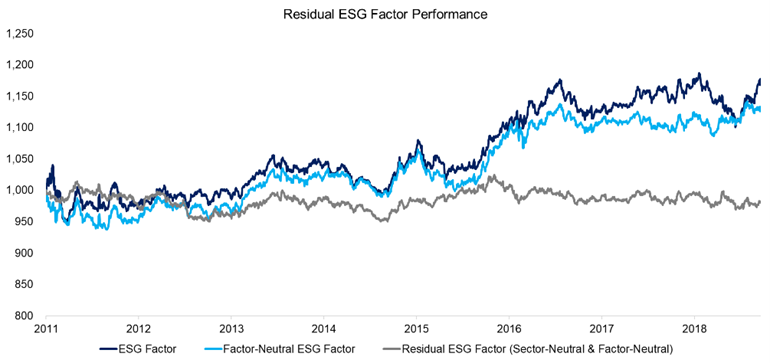
Source: FactorResearch
Download the complete ESG Observations and FY2021 Proxy Voting Report
Disclaimer
This communication is prepared by Longwave Capital Partners (‘Longwave’) (ABN 17 629 034 902), a corporate authorised representative (No. 1269404) of Pinnacle Investment Management Limited (‘Pinnacle’) (ABN 66 109 659 109, AFSL 322140) as the investment manager of Longwave Australian Small Companies Fund (ARSN 630 979 449) (‘the Fund’). Pinnacle Fund Services Limited (‘PFSL’) (ABN 29 082 494 362, AFSL 238371) is the product issuer of the Fund. PFSL is not licensed to provide financial product advice. PFSL is a wholly-owned subsidiary of the Pinnacle Investment Management Group Limited (‘Pinnacle’) (ABN 22 100 325 184). The Product Disclosure Statement (‘PDS’) and Target Market Determination (‘TMD’) of the Fund are available via the links below. Any potential investor should consider the PDS and TMD before deciding whether to acquire, or continue to hold units in, the Fund.
Link to the Product Disclosure Statement: WHT9368AU
Link to the Target Market Determination: WHT9368AU
For historic TMD’s please contact Pinnacle client service Phone 1300 010 311 or Email service@pinnacleinvestment.com
This communication is for general information only. It is not intended as a securities recommendation or statement of opinion intended to influence a person or persons in making a decision in relation to investment. It has been prepared without taking account of any person’s objectives, financial situation or needs. Any persons relying on this information should obtain professional advice before doing so. Past performance is for illustrative purposes only and is not indicative of future performance.
Whilst Longwave, PFSL and Pinnacle believe the information contained in this communication is reliable, no warranty is given as to its accuracy, reliability or completeness and persons relying on this information do so at their own risk. Subject to any liability which cannot be excluded under the relevant laws, Longwave, PFSL and Pinnacle disclaim all liability to any person relying on the information contained in this communication in respect of any loss or damage (including consequential loss or damage), however caused, which may be suffered or arise directly or indirectly in respect of such information. This disclaimer extends to any entity that may distribute this communication.
Any opinions and forecasts reflect the judgment and assumptions of Longwave and its representatives on the basis of information available as at the date of publication and may later change without notice. Any projections contained in this presentation are estimates only and may not be realised in the future. Unauthorised use, copying, distribution, replication, posting, transmitting, publication, display, or reproduction in whole or in part of the information contained in this communication is prohibited without obtaining prior written permission from Longwave. Pinnacle and its associates may have interests in financial products and may receive fees from companies referred to during this communication.
This may contain the trade names or trademarks of various third parties, and if so, any such use is solely for illustrative purposes only. All product and company names are trademarks™ or registered® trademarks of their respective holders. Use of them does not imply any affiliation with, endorsement by, or association of any kind between them and Longwave.